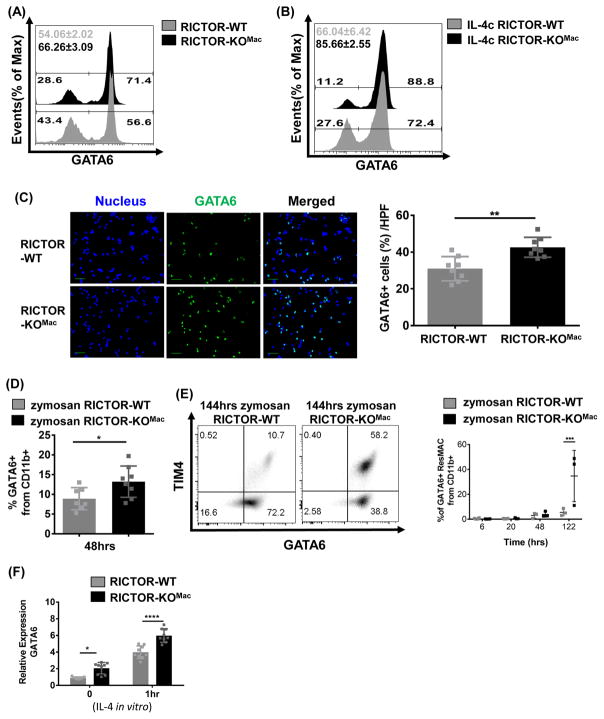
Figure 5. mTORC2 is a negative regulator of GATA6.
Representative flow histogram plot of GATA6 expression of CD11b+ cells (A) from peritoneal cells of naïve RICTOR-WT and RICTOR-KOMac and (B) from IL-4c injected WT and RICTOR-KOMac mice. (C) Peritoneal exudate cells from naïve RICTOR-WT and RICTOR-KOMac were stained with GATA6 (green). Nucleus was stained with DAPI (blue). Representative images are shown (Left) and GATA6 positive cells per high power field (HPF) were determined by counting (Right) (100x magnification, scale bar=10μm). (D–E) Same as figure 4B–E (in vivo Zymosan A) (D) Percentages of GATA6+ cells from CD11b+ population after 48hrs zymosan induced peritonitis. (E) Representative flow plot of TIM4 and GATA6 expression from CD11b+ population after 144hrs zymosan induced peritonitis. Percentages of GATA6+ ResMφ (CD11b+TIM4+F4/80hi) at each time point are shown (N=3–4/group). (F) After 3hr incubation, attached cells from naïve WT and RICTOR-KOMac mice were incubated with recombinant IL-4 (10ng/ml) and collected at indicated time points. Total RNA was extracted and relative expression of GATA6 was determined by q-PCR. Data are representative of at least three independent experiments. Statistical significance of (C–D) were determined by Mann-Whitney t tests and (E–F) were determined by two-way ANOVA with Bonferroni post-test (Mean±SD, N=3). *P < 0.05, **P < 0.01, ***P < 0.001, ****P < 0.0001

