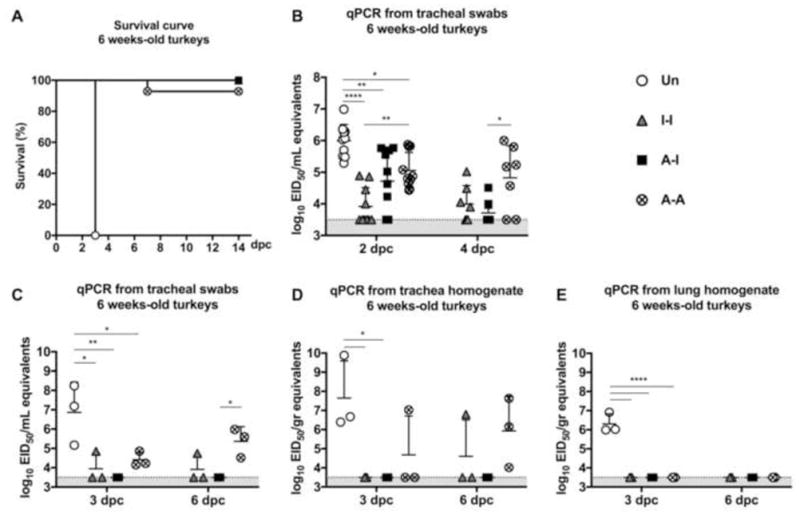
Figure 3. Protective efficacy in 6-week old turkeys.

(A) Survival curve after challenge. Virus shedding in (B) tracheal swabs collected at 2 dpc (n=10/group) and 4 dpc (n=7/group); and from euthanized animals at 3 dpc (n=3/group) and 6 dpc, (C) tracheal swabs, (D) tracheal homogenates, and (E) lung homogenates. Plotted data: means + SD. One-way or Two-way ANOVA was performed. *, P<0.05; **, P<0.01; ****, P<0.0001.
