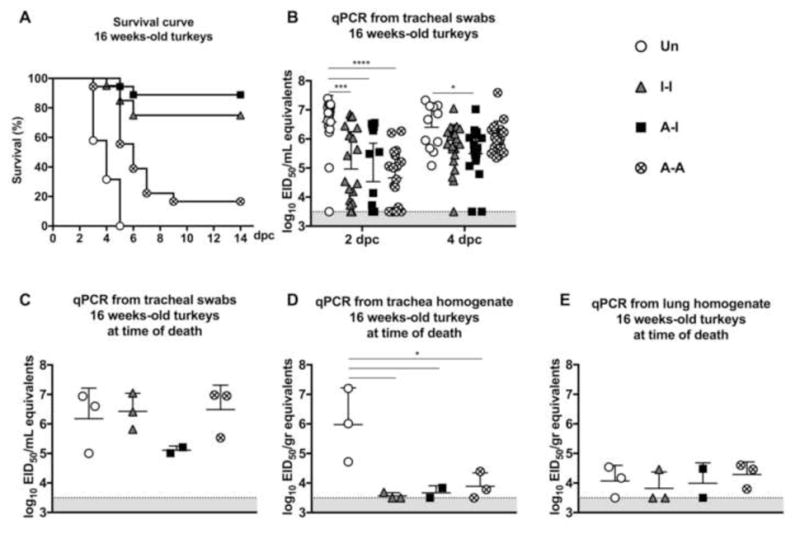
Figure 4. Protective efficacy in 16-week old turkeys.

(A) Survival curve following challenge Virus shedding in (B) tracheal swabs collected at 2 dpc [n=19 (Un), n=20 (I-I), n=19 (A-I) and n=18 (A-A)] and 4 dpc [n=11 (Un), n=20 (I-I), n=19 (A-I) and n=17 (A-A)]; and from subset of birds displaying severe disease signs or succumbed to infection at the time of necropsy [n=3 (Un), n=3 (I-I), n=2 (A-I) and n=3 (A-A)], (C) tracheal swabs, (D) tracheal homogenates, and (E) lung homogenates. Plotted data: means + SD. Statistical analyses as in Fig 3. *, P<0.05; ***, P<0.001; ****, P<0.0001.
