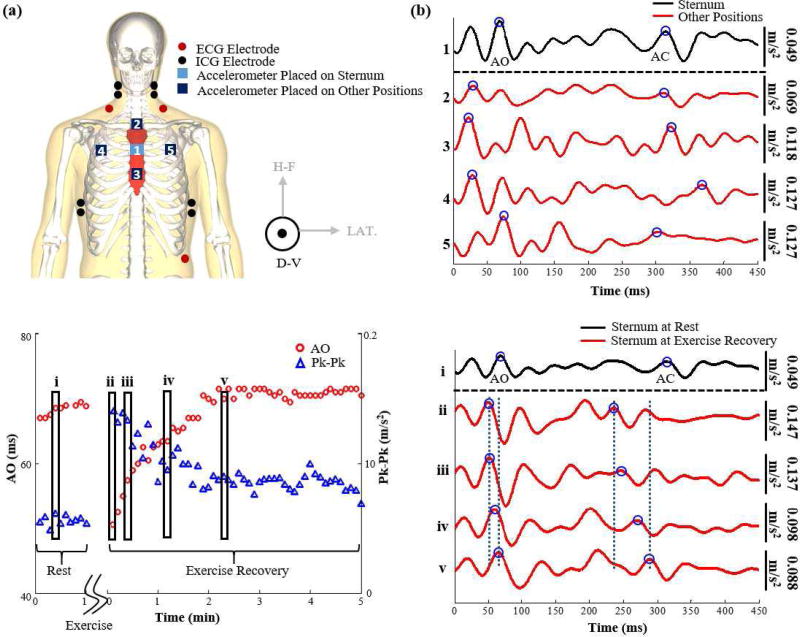
Fig. 1.
(a) Modified from [1]. An illustration of the experimental setup. ECG, ICG and SCG signals were collected. SCG was collected on two separate days; the first day included SCG signals from an accelerometer on the sternum, and accelerometers to the left and right of it and the second day included SCG signals from an accelerometer on the mid-sternum and accelerometers on the upper and lower sternum. Each of these accelerometers measure three dimensional SCG but only the dorsoventral component was used in this analysis. (b) A 450 ms portion of one ensemble averaged beat of an SCG signal collected from the accelerometer placed on the sternum vs SCG signals collected from the other accelerometers at rest. . All these ensemble averages begin at the time of occurrence of the ECG R-peak The mid-sternal signal was doubled in scaling to make the comparison easier. It can be observed that the waveforms are very different in their shapes and result in different estimations of the aortic valve opening (AO) and aortic valve closure (AC) points. (c) The variation in AO and peak-to-peak amplitude of the dorsoventral SCG signal collected from mid-sternum as the physiological state of the subject changes between rest and exercise recovery. It can be noted that right after exercise the AO time decreases while the peak-to-peak amplitude increases only to stabilize back to baseline value as time passes. The five rectangles represent the AO and peak-to-peak values of the five waveforms shown in part (d) for the different physiological states. (d) A 450 ms portion of an ensemble average of dorsoventral SCG beats collected from the sternum during rest and different states during exercise recovery. We can observe that the waveforms look similar for a time shift and an increase in amplitude after exercise.

