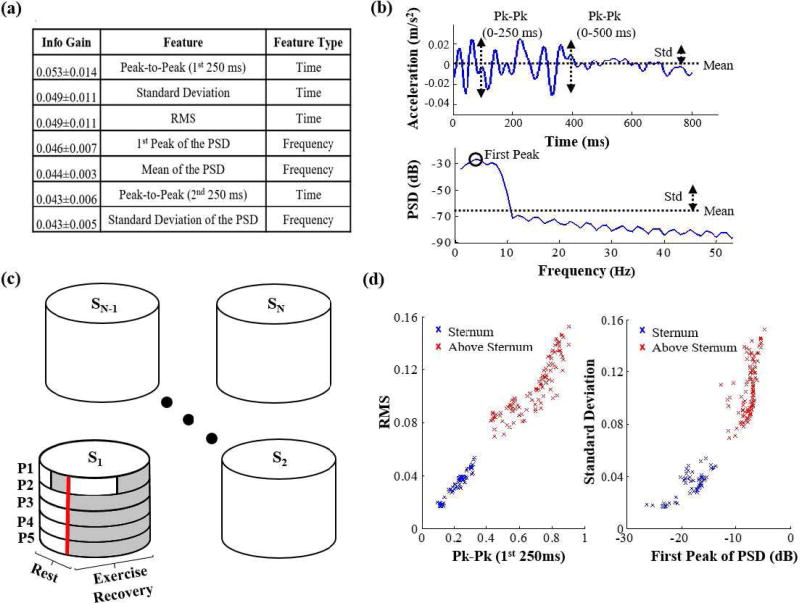
Fig. 5.
(a) The top attributes (features) organized in the order of descending average of information gain among the 10 training sets. (b) an illustration of some of the top features in the time and frequency domain. (c) The training and testing sets for training and testing the classifier on subject 1. The shaded areas are features that are excluded from the training set and included in the testing sets when trying to detect the sensor position for subject 1. (d) the best feature in terms of info gain (Peak-to-Peak in the 1st 250 ms) plotted against the 3rd feature (RMS) and the 2nd feature (Standard deviation) plotted against the 4th feature (1st peak of the PSD) for one position (upper-sternum) compared to the mid-sternal position in one of the test sets. It is clear that those features result in two distinct clusters for these two positions which indicates that the position of the sensor (accelerometer) can be accurately detected.

