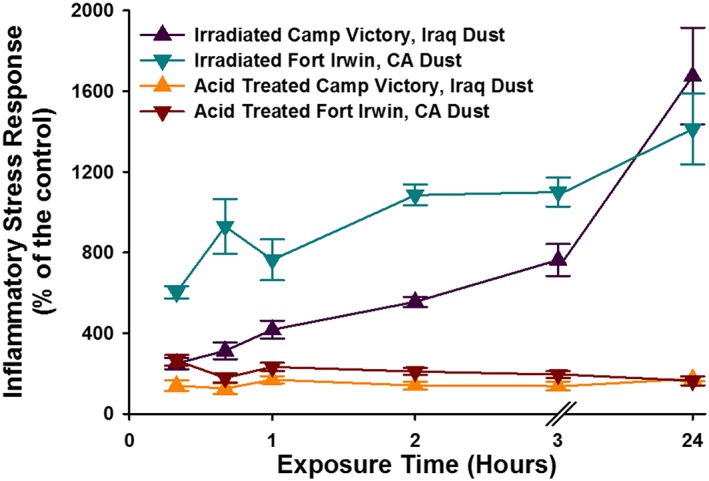
Figure 7.

The temporal evolution of the ISR generated by elevated particle loadings (0.025 m2/mL) for Camp Victory and Fort Irwin dust samples. Also represented are the dust samples that were treated with acid to remove carbonate phases. For some data points, the error bars are hidden by the symbols.
