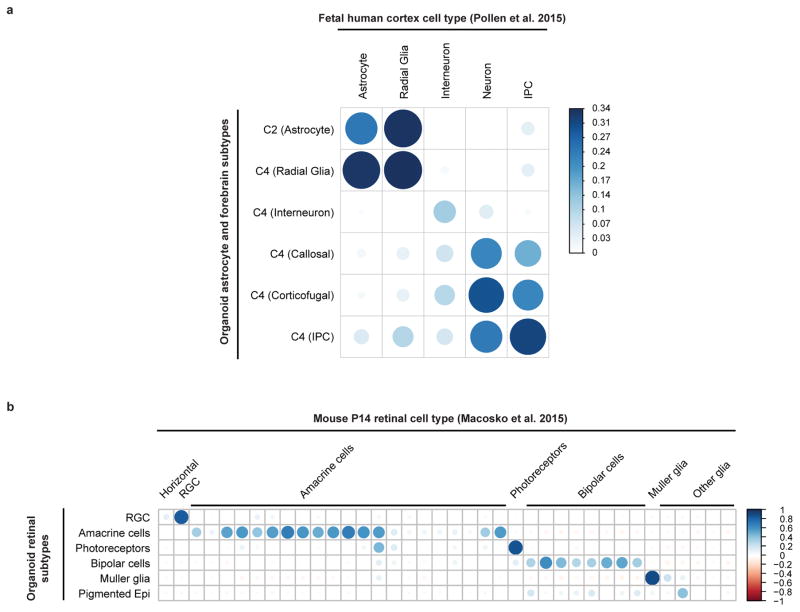
Extended Data Figure 5. Correlation analysis for organoid cell types vs. fetal human cortex and mouse retina.
a. Correlation between expression patterns of highly variable genes between cell populations within a previously published single-cell RNAseq dataset of human fetal cortex22 against the organoid astrogial cluster (c2) and the identified subclusters of the forebrain cluster (c4). IPC, intermediate progenitor cells. b. Correlation between expression patterns of highly variable genes between cell populations within a previously published single-cell RNAseq dataset of P14 mouse retina11 and the cell populations identified within the retinal cluster (c5) in our organoid dataset. RGC: retinal ganglion cells; Pigmented Epi: pigmented epithelium. Scale bars represent the range of the coefficients of determination (r2) in each analysis.

