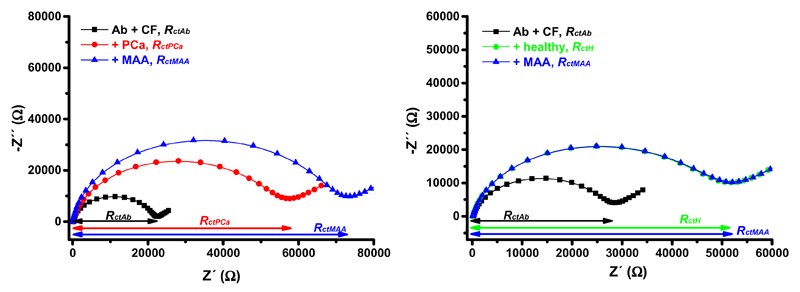
Figure 2.
Nyquist plots of the immunosensor before incubation with a sample (i.e. immunosensor with immobilized antibody (Ab) and blocked by a CF buffer, i.e. Ab + CF, black line and symbols), after incubation with a serum sample from a healthy individual (right, +healthy, green line and symbols) or after incubation with a serum sample from a PCa patient (left, +PCa, red line and symbols), and after interaction with MAA lectin (blue line and symbols). Please note that for examination of the serum sample from the healthy individual blue line and symbols overlap green line and symbols. Both serum samples were diluted with an optimal dilution fold 1+1,000 in a PBS buffer prior to analysis by the biosensor. EIS assay conditions are described in Fig. 1.

