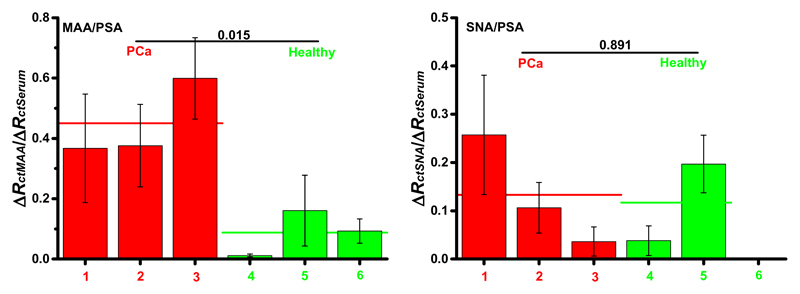
Figure 3.
The biosensor response obtained after the addition of lectin (i.e. proportional to the amount of a particular glycan on PSA) was divided by the biosensor response obtained after incubation with a serum sample (i.e. proportional to the PSA level in the serum sample) and the relative responses (MAA/PSA or SNA/PSA) using 6 samples (3 from PCa patients and 3 from healthy individuals) and two lectins (SNA and MAA) are shown here. Two different lectins, i.e. SNA recognizing terminal α-2,6-linked sialic acid and MAA recognizing terminal α-2,3-linked sialic acid, were applied in the study. A t-test was employed to determine whether the differences between these two sets of samples are significant, with t-values indicated in the figures. Moreover, the average values for each data set are indicated by the horizontal line. EIS assay conditions are described in Fig. 1.

