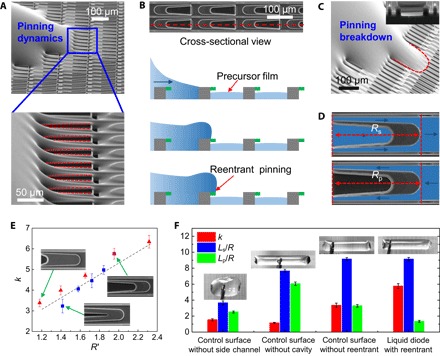
Fig. 3. Microscopic pinning dynamics and quantification of rectification coefficient.

(A) SEM images showing the pinning of advancing liquid at the reentrant structure (top). The red lines in the magnified SEM image (below) denote the pinning of the liquid at the reentrant edge. (B) Schematic drawing of the effect of reentrant structure (in green) on the liquid penetration. In conjunction with the concave meniscus in the diverging channel, the advancing edge in the primary droplet fails to coalesce with the precursor liquid. (C) SEM image of the breakdown of the liquid pinning on control surface without the reentrant structure. It is clear that the advancing liquid penetrates the cavity, and the pinning effect is collapsed as depicted by the red dashed line. The inset shows the side view of the cavity with a straight sidewall. (D) Schematic drawing of the flow pathways in spreading and pinning directions. (E) Plot of the rectification coefficient (k) versus R′, the ratio of hydraulic resistances between two different directions. Here, the R′ can be tailored by varying sizes in the cavity length or width. The red triangles indicate a series of surfaces with increasing cavity length (l/L = 1/6, 1/3, 1/2, 2/3, and 5/6), but with constant width (d/D = 3/5), as shown in table S2 and fig. S8A. The blue squares indicate a series of surfaces with increasing cavity width (d/D = 1/5, 3/10, 2/5, 1/2, and 3/5), but with constant length (l/L = 2/3), as shown in table S3 and fig. S8B. (F) Comparison of the transport performances between different surfaces. The blue and green symbols indicate the spreading lengths normalized by the droplet radius at the spreading direction and pinning direction, respectively. The red symbol denotes the rectification coefficient (k) on different designs. The inset images present the optical image of spreading drops on the respective surfaces.
