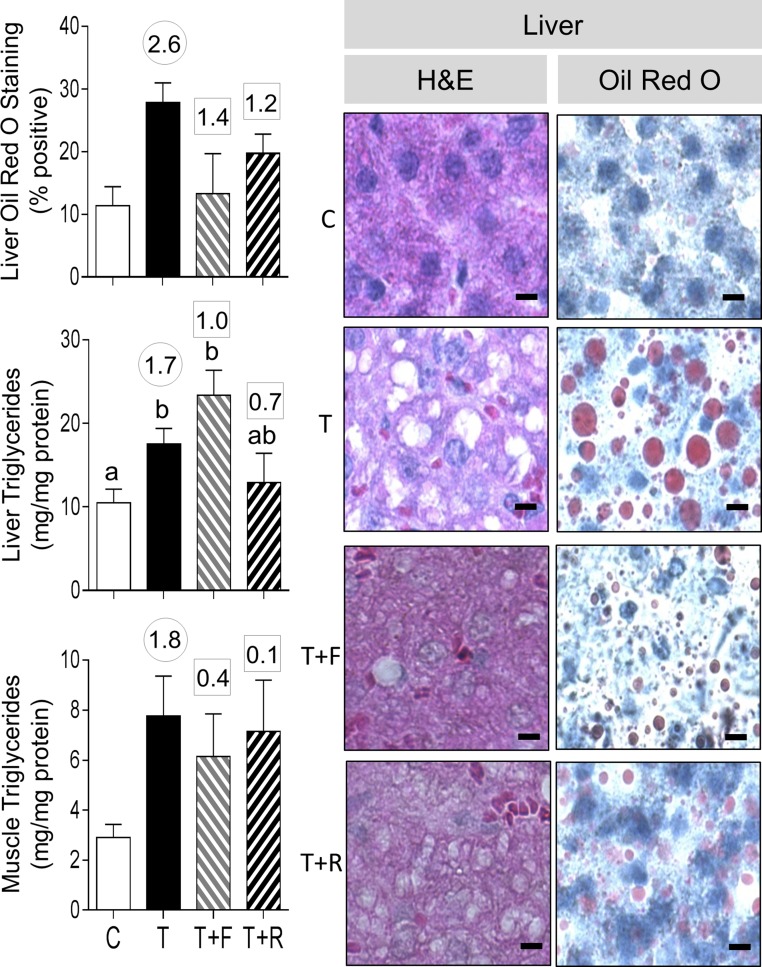
Figure 11.
Ectopic lipid accumulation in liver from C, T, T+F, and T+R groups. Photomicrographs of histochemical analysis by both H&E staining of paraffin-embedded and Oil Red O staining in cryosections from liver are shown in the right panels (bar = 25 μm). On the left are shown mean ± standard error of the mean of the percent staining of Oil Red O in liver (top left) and triglyceride content in liver (left middle) and muscle (left bottom). Differing letters above the histogram indicate significant changes by ANOVA. Numerical superscripts are Cohen d values comparing (1) C vs T (within the circle) and (2) T+F and T+R vs T (within the square box).

