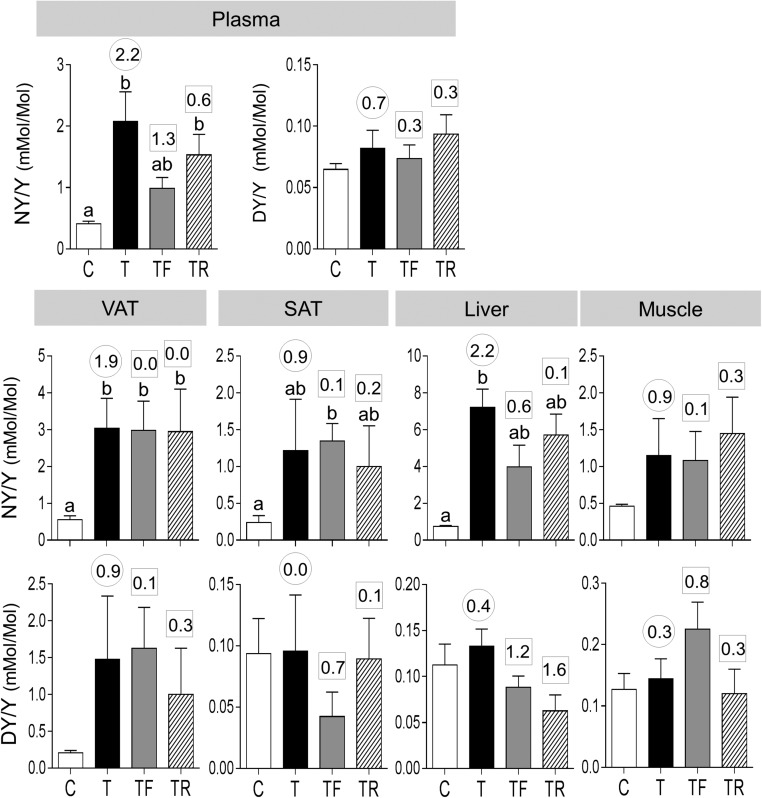
Figure 5.
Plasma and tissue oxidized tyrosine concentrations in C, T, TF, and TR groups (mean ± standard error of the mean). The concentrations of NY and DY are expressed as the ratio of oxidized tyrosine to total tyrosine in plasma (top panels) and NY (middle panel) and DY (bottom panel) in the VAT, SAT, liver, and muscle. Differing letters above the histogram indicate significant changes by ANOVA. Numerical superscripts are Cohen d values comparing (1) C vs T (within the circle) and (2) TF and TR vs T (within the square box).

