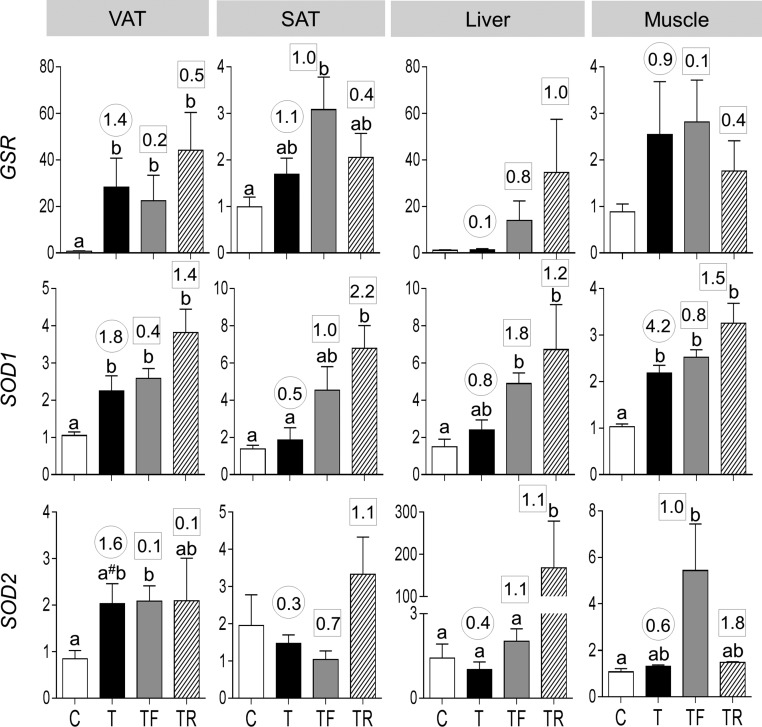
Figure 6.
Antioxidant [GSR (top panels), SOD1 (middle panels), and SOD2 (bottom panels)] expression in the VAT, SAT, liver, and muscle tissues of C, T, TF, and TR groups (mean ± standard error of the mean). Differing letters above the histogram indicate significant changes by ANOVA. Numerical superscripts are Cohen d values comparing (1) C vs T (within the circle) and (2) TF and TR vs T (within the square box). #Indicates significant difference between C and T groups as determined by Student t test.

