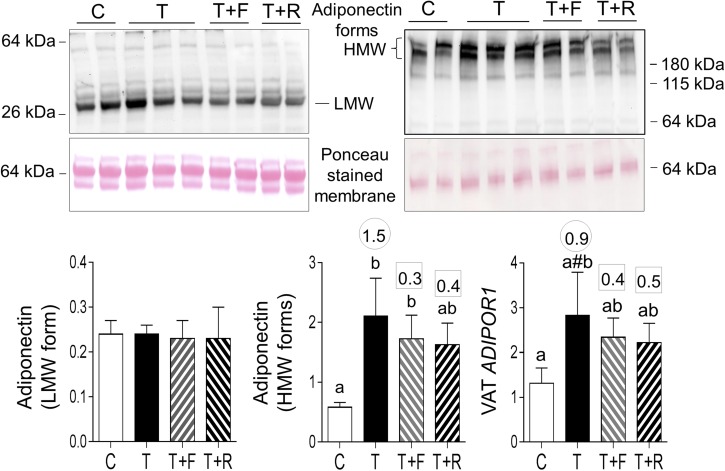
Figure 8.
Plasma levels of LMW and HMW forms of adiponectin and mRNA expression of ADIPOR1 in VAT in C, T, T+F, and T+R groups. Top panels show representative blots under reducing conditions (left: LMW) and nonreducing conditions (right: HMW forms) along with Ponceau staining to depict protein loading. Bottom panels show mean ± standard error of the mean of density ratios between LMW (bottom left) and HMW (bottom middle) of adiponectin with the 64-kDa protein from the Ponceau-stained membrane. Bottom right shows mRNA expression levels of ADIPOR1. Differing letters above the histogram indicate significant changes by ANOVA. Numerical superscripts are Cohen d values comparing (1) C vs T (within the circle) and (2) T+F and T+R vs T (within the square box). #Indicates significant difference between C and T groups as determined by Student t test.

