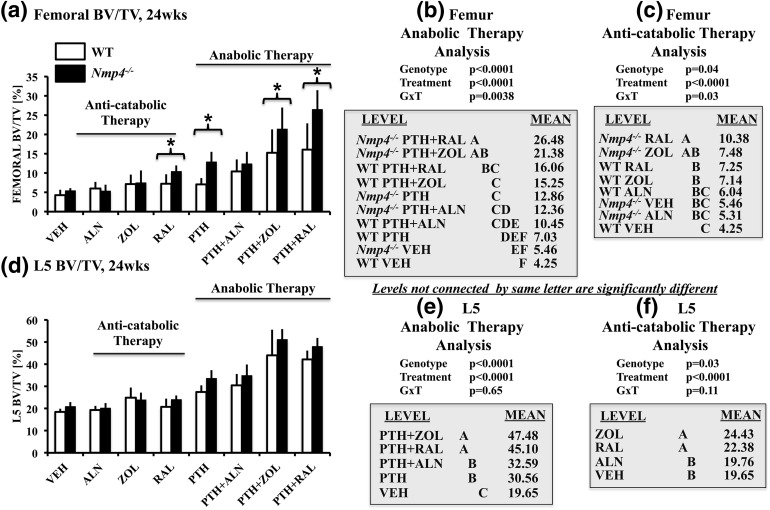
Figure 2.
(a–c) Femoral BV/TV and (d–f) L5 BV/TV for all the experimental cohorts (age 24 weeks) comparing ovariectomized WT and Nmp4−/− mice. (b and e) We compared the anabolic therapies PTH + RAL, PTH + ZOL, PTH + ALN, and PTH with each other and with VEH. (c and f) We compared the anticatabolic treatments ALN, ZOL, and RAL with each other and with VEH. Statistical analyses were performed using two-way analyses of variance, setting genotype and treatment as the independent variables. Statistical significance was set at P ≤ 0.05. The asterisk denotes genotype × treatment interaction. The data represent mean ± standard deviation, n = 7 to 12 mice per group. See text for explanation of results.

