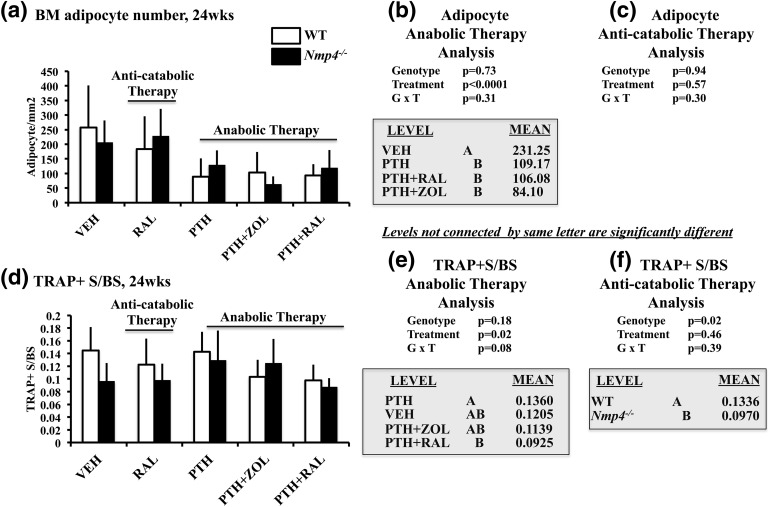
Figure 7.
(a–c) Bone marrow (BM) adipocytes and (d–f) TRAP+ S/BS for WT and Nmp4−/− mice (24 weeks of age). (b and e) We compared the anabolic therapies PTH + RAL, PTH + ZOL, and PTH with each other and with VEH using either adipocyte number or TRAP+ S/BS as the endpoints. (c and f) We compared the number of adipocytes or the TRAP+ S/BS in the WT and Nmp4−/− RAL monotherapy cohorts. Statistical analyses were performed using two-way analyses of variance, setting genotype and treatment as the independent variables. Statistical significance was set at P ≤ 0.05. The data represent mean ± standard deviation, n = 5 fields from six mice per cohort for the adipocytes and n = 6 mice per group (TRAP+ S/BS). See text for explanation of results.

