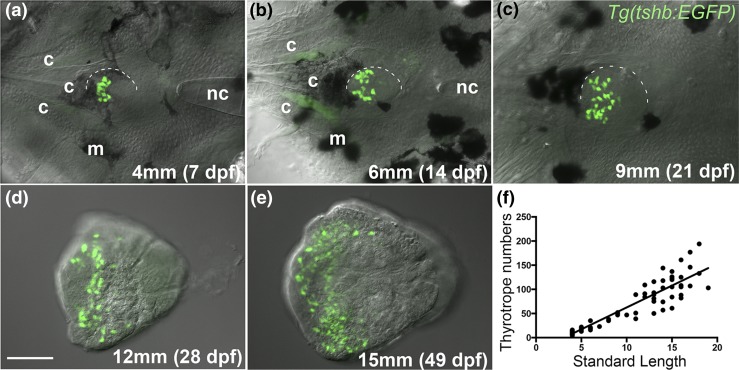
Figure 1.
Increases in thyrotrope numbers through larval development. (a–e) Ventral views (anterior left) of zebrafish pituitaries in the Tg(tshb:EGFP) line showing GFP-expressing thyrotropes. Pituitaries (half outlined) were imaged in situ up to 21 dpf (9 mm standard length), with cartilage elements and melanocytes visible in these images. (d, e) In older fish, pituitaries were dissected and imaged in isolation. (f) Thyrotrope numbers plotted against standard length. Each data point represents a single individual. R2 = 0.87. Scale bar, 50 µm. c, cartilage element of the upper jaw/cranium; m, melanocyte.

