Figure 2.
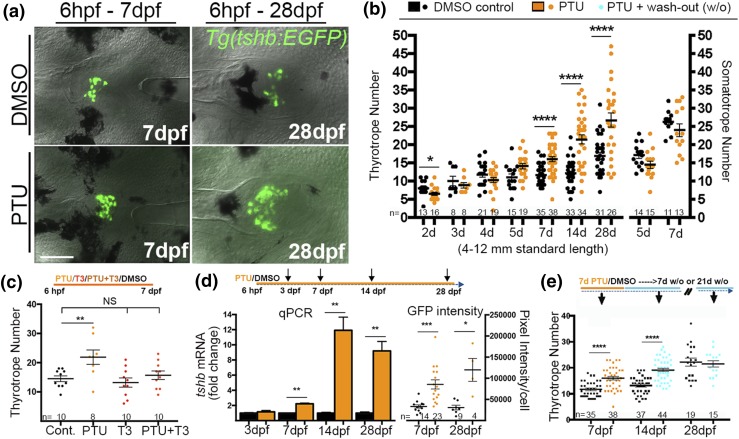
Effects of low thyroid conditions on larval thyrotrope numbers. (a) Ventral views of GFP-expressing thyrotropes in 7 dpf (left) and 28 dpf (right) Tg(tshb:EGFP) pituitaries grown in 0.65 mM PTU or DMSO (control) starting at 6 hpf. (b) Quantification of thyrotropes (left) and somatotropes (right) in larvae grown in PTU or DMSO starting at 6 hpf. (c) Thyrotrope numbers at 7 dpf in larvae grown in PTU, a low dose of T3, or PTU+T3 starting at 6 hpf. T3 addition rescued PTU-induced thyrotrope increases, consistent with PTU treatments reducing bioactive TH levels. (d) Relative tshb mRNA levels in larvae treated starting at 6 dpf (left). Relative GFP pixel intensity/cell at 7 and 28 dpf in larvae treated with PTU or DMSO starting at 6 hpf (right). (e) Thyrotrope numbers in larvae exposed to PTU from 0 to 7 dpf followed by 7 or 14 days of growth in system water without PTU (w/o, wash-out). Increased thyrotrope numbers persisted for 7 days after removal of PTU, but the thyrotrope population was indistinguishable from controls (no PTU treatment) after 21 days. (b, d, and e) Values are shown as the mean ± SEM (Student t test). (c) ANOVA followed by Dunnett test was used to compare every mean with control. *P < 0.05; **P < 0.01; ***P < 0.001; ****P < 0.0001. Scale bar, 50 µm.

