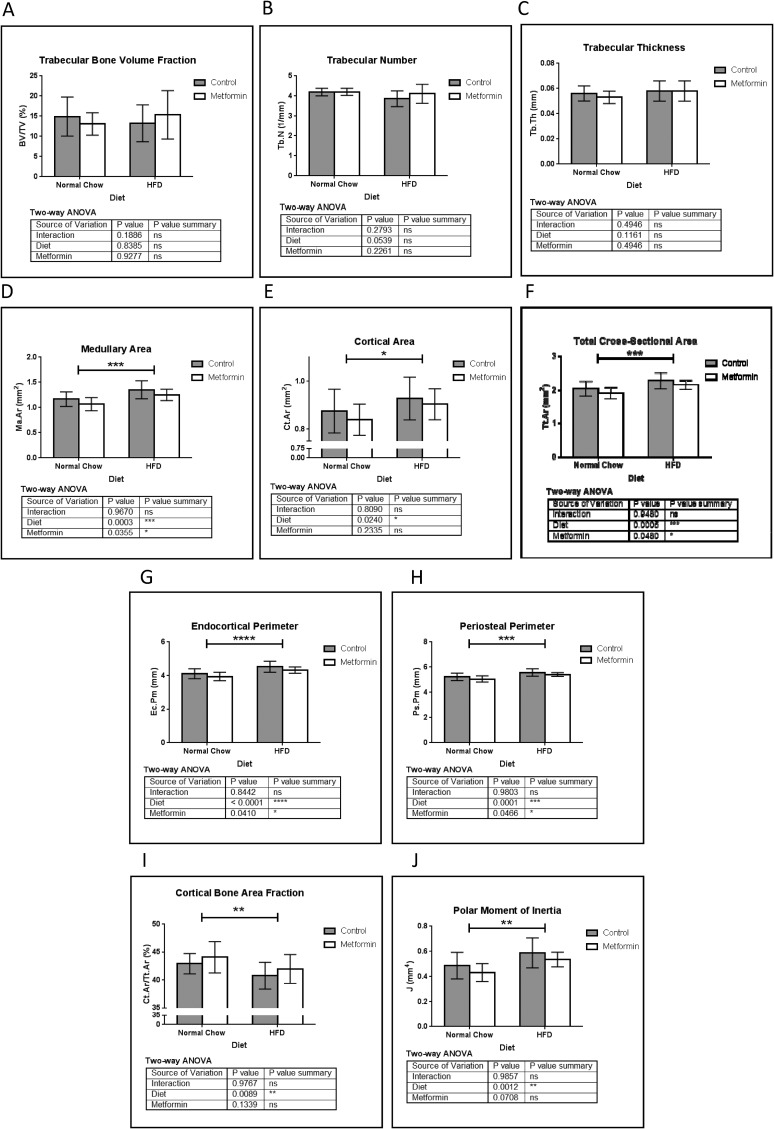
Figure 3.
μCT analysis of femur. Similar to tibia, (A) femoral bone volume fraction (BV/TV) and (B) trabecular number (Tb.N) showed no significant differences between all groups. No changes were observed in (C) Tb.N . Cortical bone showed a DIO response similar to the tibia. (D) Femur medullary area (Ma.Ar) was increased with HFD, and this was normalized by metformin. (E) Cortical area (Ct.Ar) and (F) total cross-sectional area (Tt.Ar) were significantly increased with HFD. Similarly, endocortical perimeter (Ec.Pm) (G) and periosteal perimeter (Ps.Pm) (H) were significantly increased by HFD and decreased by metformin. (I) Ct.Ar fraction was significantly decreased by HFD, and this was normalized partially by metformin treatment. These changes resulted in a significant increase in polar moment of inertia by HFD (J), which was partially restored to normal by metformin. Data represent mean ± SD analyzed with two-way ANOVA, n = 10 mice for all groups.

