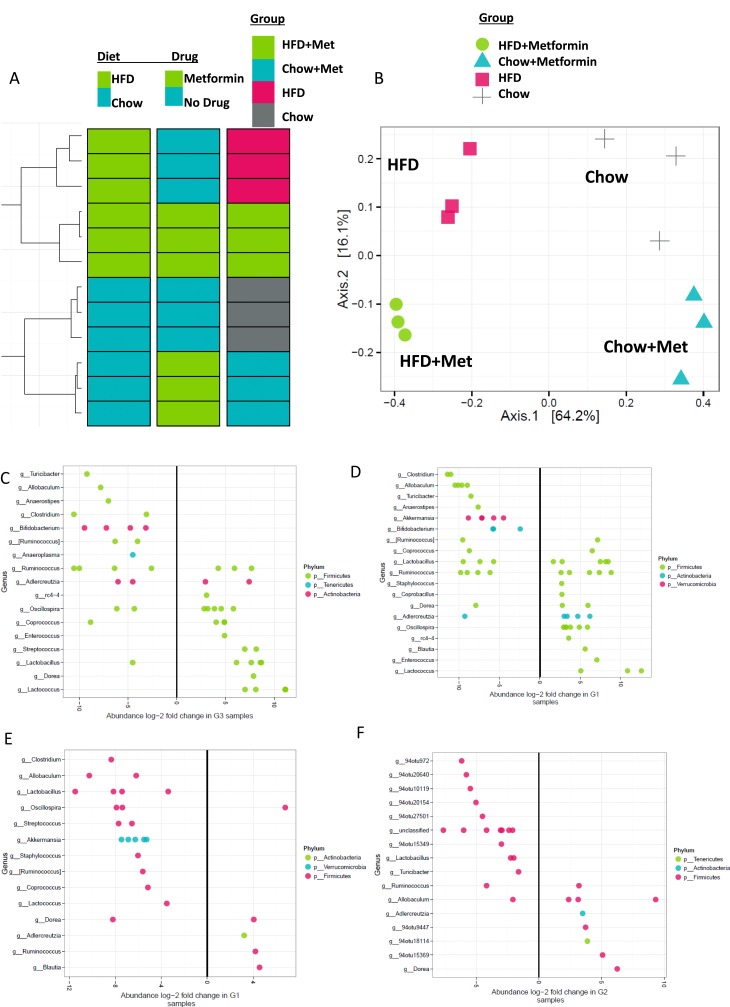
Figure 7.
Cluster analysis of gut microbiome from 16S rRNA sequencing. 16S sequencing was performed on feces-derived DNA. (A) Hierarchical clustering revealed diet and drug effects to be driven mostly by diet, and secondarily by metformin. (B) Principal component analysis of microbial compositions demonstrated that diet is the overwhelming driver of each sample’s microbial community composition. Within each diet, metformin (met) treatment influences the microbiota composition. Abundance long-twofold changes for OTUs in (C) HFD vs chow, (D) HFD + met vs HFD + chow, (E) HFD + met vs HFD, and (F) chow + met vs chow mice. n = 3 mice.

