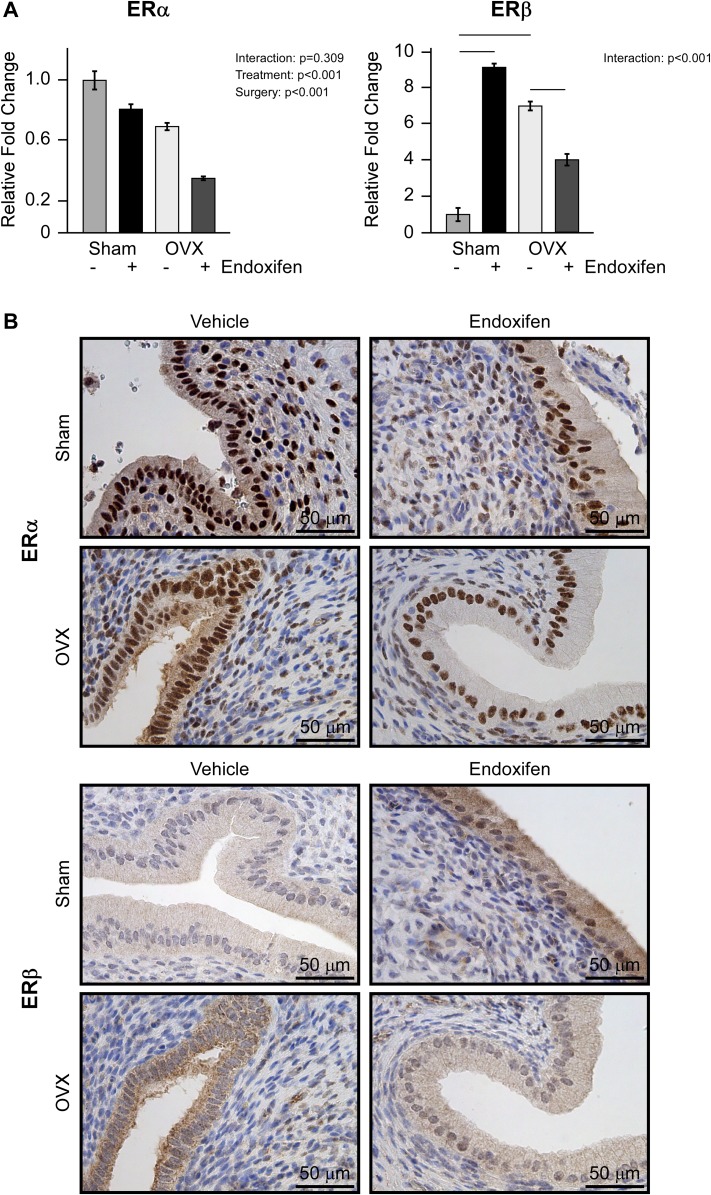
Figure 7.
Uterine ERα and ERβ expression following endoxifen treatment of ovary intact and ovariectomized (OVX) rats. (A) Reverse transcription PCR analysis of ERα and ERβ mRNA expression following 34 days of vehicle or endoxifen treatment. (B) Representative images depicting ERα and ERβ protein expression levels following vehicle or endoxifen treatment as detected by IHC analysis (×40 magnification, counterstained with hematoxylin). The group means ± standard error are depicted. P values for the main comparisons (surgery and treatment) are indicated when the interaction was not significant. For parameters with a significant interaction, pairwise comparisons were made between individual groups and statistically significant differences are indicated by solid lines.

