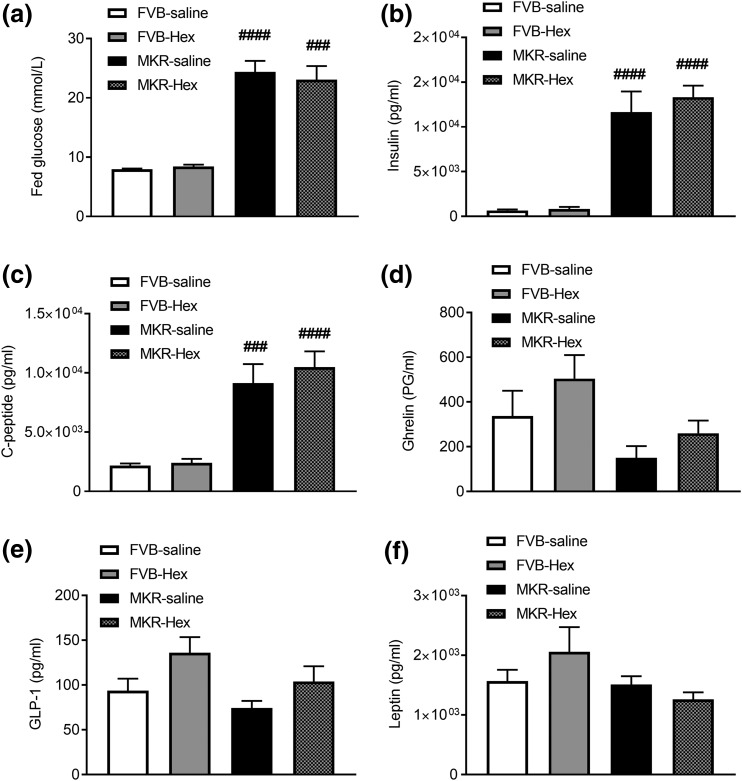
Figure 4.
The effects of hexarelin treatment on (a) blood glucose, (b) plasma concentrations of insulin, (c) C-peptide, (d) ghrelin, (e) GLP-1, and (f) leptin at the end of treatment from terminal blood samples during fed conditions. Data are expressed as mean ± SEM (n = 4 to 6 per group). ###P < 0.001, ####P < 0.0001 vs FVB saline group.

