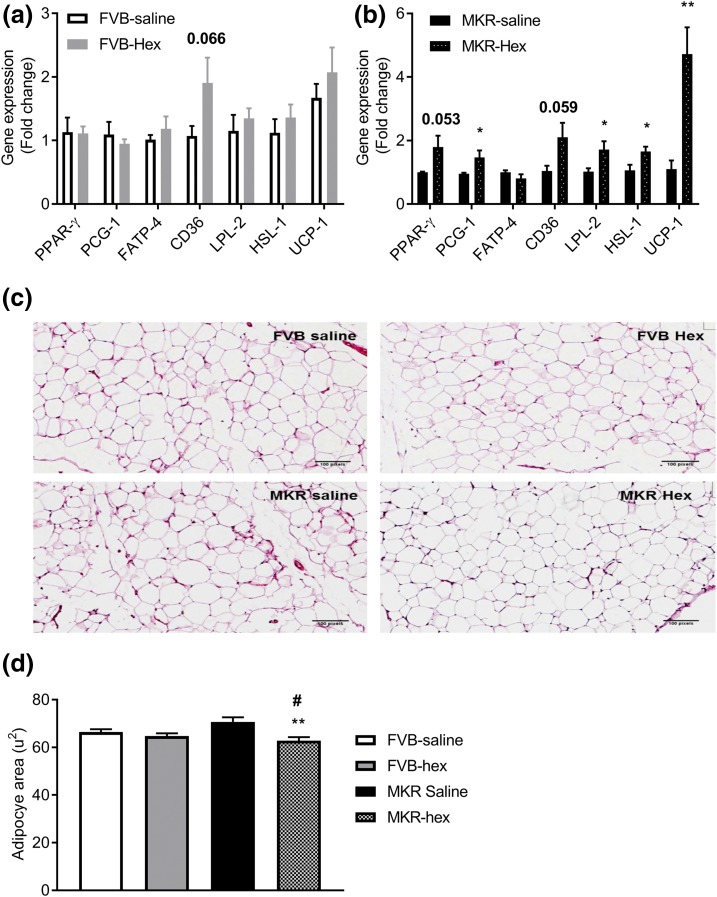
Figure 6.
Fold changes in gene expression levels of PPAR-γ, PCG-1, FATP-4, CD36, LPL, HSL, and UCP-1 of WAT of (a) FVB and (b) MKR mice after treatment. The data were calculated using the 2−ΔΔCT method. The results are presented as mean ± SEM (n = 5 to 6 per group). *P < 0.05, **P < 0.01 vs MKR saline group. (c) Hematoxylin and eosin staining of the gonadal fat pads from MKR and FVB mice treated with saline or hexarelin 12 days. Original magnification, ×10; scale bars, 100 μm. (d) Quantitative analysis of mean adipocytes area from 25 adipocytes per mouse. Data are expressed as mean ± SEM (n = 3 per group). **P < 0.01 vs MKR saline group. #P < 0.05 vs FVB saline group.

