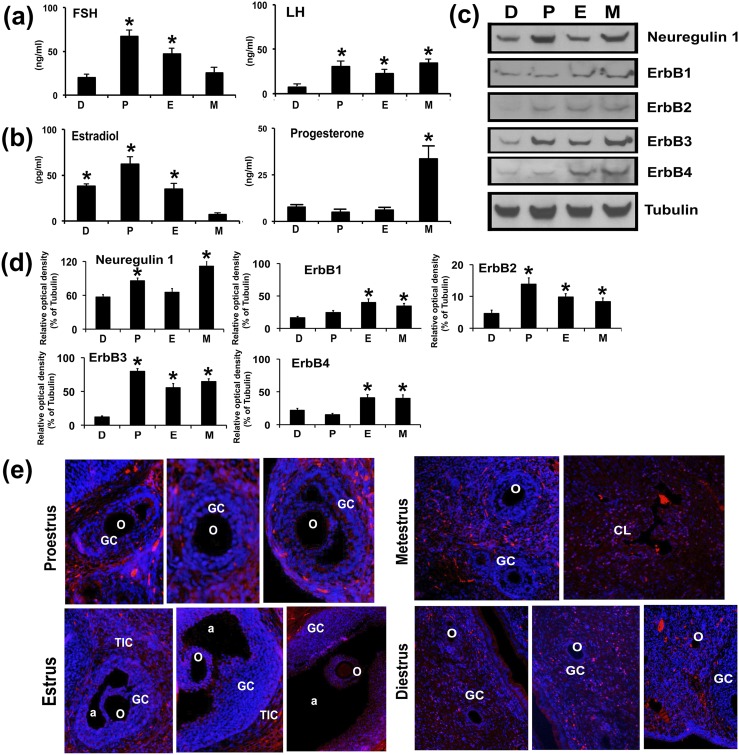
Figure 3.
Expression of NRG1 and ErbB receptors in GCs during the rat estrous cycle. Blood serum and GCs were collected throughout the estrous cycle. Bar diagrams represent the mean values of serum (a) FSH and LH and (b) E2 and P4 of the D, P, E, and M stages during the estrous cycle. (c) Representative WB analysis of protein levels of NRG1 and ErbB receptors in GCs isolated from two ovaries per rat per stage of estrous cycle. Equal amounts of protein were applied to each lane. α-Tubulin was used as an internal control. (d) Bar diagrams represent the densitometric analyses of NRG1 and ErbB receptors in WB. (e) Immunocolocalization of endogenous NRG1 with Alexa Fluor 594 labeled (red) secondary antibody in rat ovary during different stages of the estrous cycle. The nucleus was counterstained with 4′,6-diamidino-2-phenylindole (blue). All numerical values are represented as mean ± standard error of the mean of three independent experiments. A total three rats per stage of estrous cycle were used. *P ≤ 0.05 among the group. a, antrum; o, oocyte; TIC, theca-interstitial cell.

