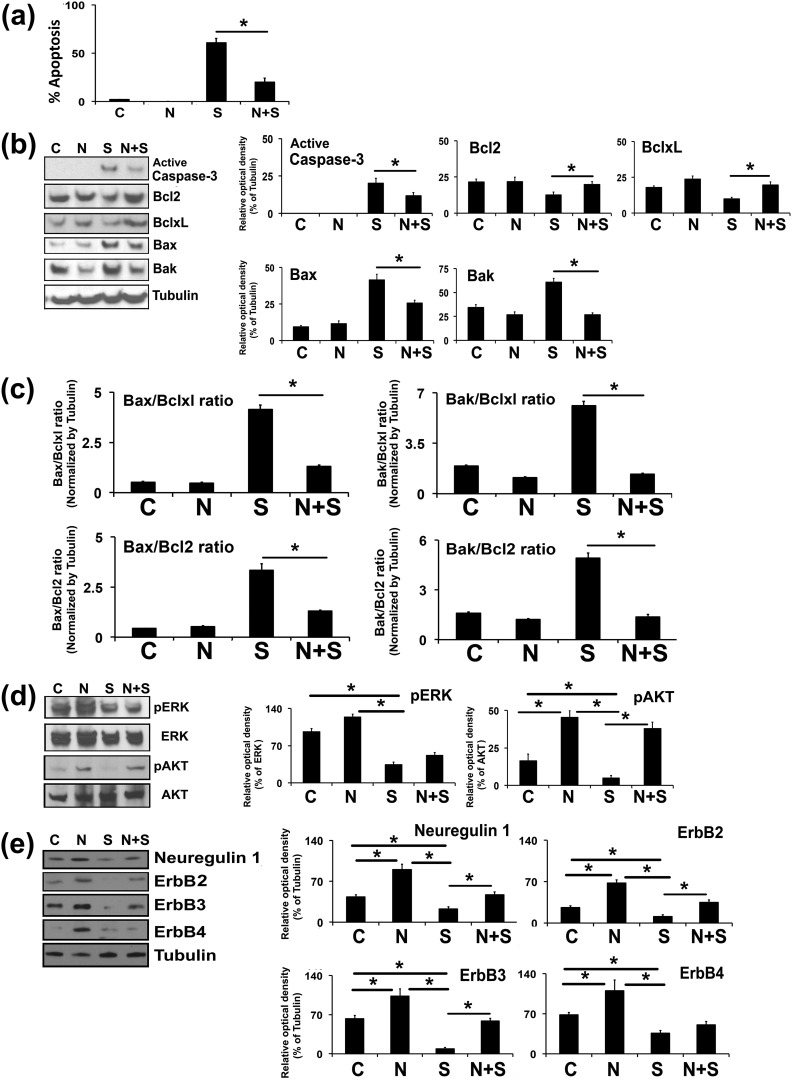
Figure 5.
Effects of exogenous cotreatment of NRG1 on the PKC inhibitor STS-induced apoptosis in undifferentiated rat GCs. Undifferentiated GCs were isolated from two ovaries per rat per sample and grown in culture dishes. Thereafter, GCs were cotreated with NRG1 along with STS (1 μM) for 3 hours in serum-free medium. (a) Bar graph represents the percentage of GCs displaying nuclear morphologic changes characteristic of apoptosis. (b) Representative WB analysis of protein levels in GCs treated by STS in the presence and absence of NRG1 for cleaved caspase-3, Bcl2, Bclxl, Bax, and Bak. α-Tubulin was used as an internal control. Bars represent the densitometric analyses of protein in WBs. (c) Bars represent the mean ± standard error of the mean of Bax-to-Bclxl, Bax-to-Bcl2, Bak-to-Bclxl, and Bak-to-Bcl2 ratios of protein levels normalized to α-tubulin from three independent experiments. (d) Representative WB analysis of protein levels in GCs treated by STS in the presence and absence of NRG1 for total Erk1/2, phospho-Erk1/2 (pErk1/2), and total Akt and phospho-Akt. Bars represent the densitometric analyses of protein in WBs. (e) Representative WB analysis of protein levels in GCs treated by STS in the presence and absence of NRG1 for NRG1 and ErbB receptors. α-Tubulin was used as an internal control. Bar diagrams represent the densitometric analyses of protein in WBs. Equal amounts of protein were applied to each lane and the WB was analyzed for different proteins. Data, given as mean ± standard error of the mean, are representative of three independent experiments that were performed for each individual group. *P ≤ 0.05 between STS and NRG1 plus STS groups. C, control; S, staurosporine; N, Neuregulin-1.

