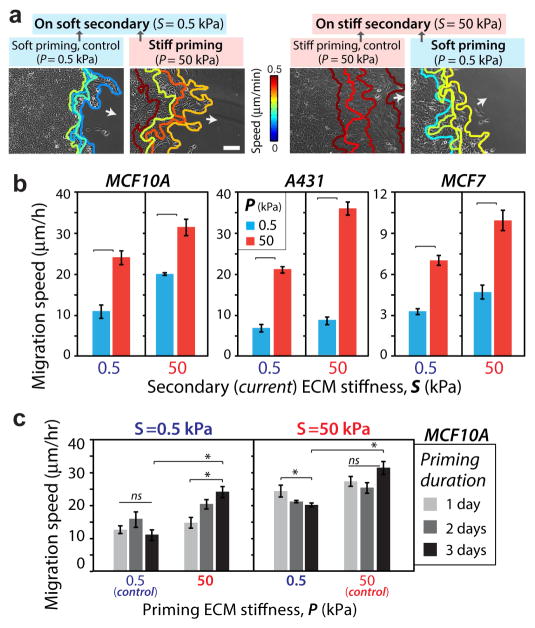
Figure 2. Collective cell migration speed depends on priming by the past ECM stiffness.
(a) Representative leading-edge tracks of monolayers of MCF10A cells recorded for 12 hours (3 h interval) in the secondary ECM after 3-day priming, with color-coding for migration speed. Arrows indicate direction of migration. Scale bar = 100 μm. (b) Average leading-edge migration speed for MCF10A, A431, and MCF7 cells migrating on secondary ECM (S=0.5, 50 kPa) after defined priming (P=0.5, 50 kPa). Horizontal square brackets denote statistical significance (p<0.05). N>15. (c) Average leading-edge migration speed for MCF10A cells after 1, 2, or 3 days of priming. *p3<30.05, with horizontal square brackets denoting statistical significance (p<0.05). ns=no significant difference. Error bars = SEM. N>10.

