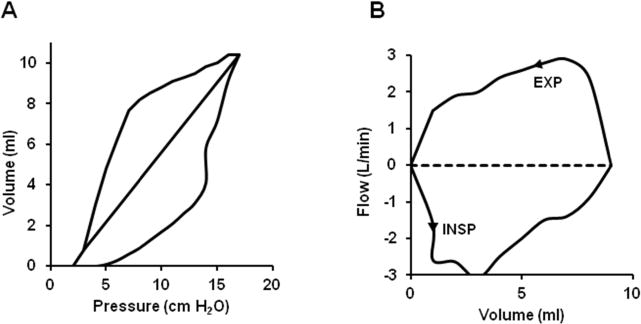
Figure 1.

Modified pulmonary graphics of the transpulmonary pressure volume (A) and flow volume (B) relationships from the patient with Barnes syndrome. The right limb of the transpulmonary pressure-volume curve represents inspiration, and the left limb of the transpulmonary pressure-volume curve represents deflation. The C20/C total ratio represents the ratio of the slope of the last 20% of the inflation curve divided by C total as represented by the straight solid line in the middle of the transpulmonary pressure volume curve. C, compliance.
