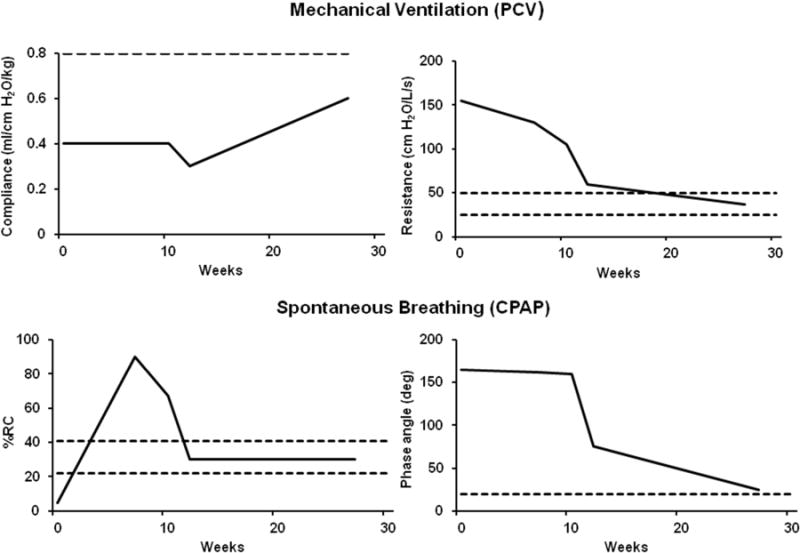
Figure 2.

Trends in respiratory mechanics and thoracoabdominal measurements at baseline (0; 8 weeks postnatal/5 weeks on drug) and in response to ENB-0040. Solid line indicates averaged patient measurements. Dashed line indicates predicted normal values. PCV, pressure control ventilation; CPAP, continuous positive airway pressure; %RC, percentage of rib cage contribution to tidal volume excursions; phase angle in degrees. Illustrations modified from Rodriguez et al. [33].
