
Figure 4.
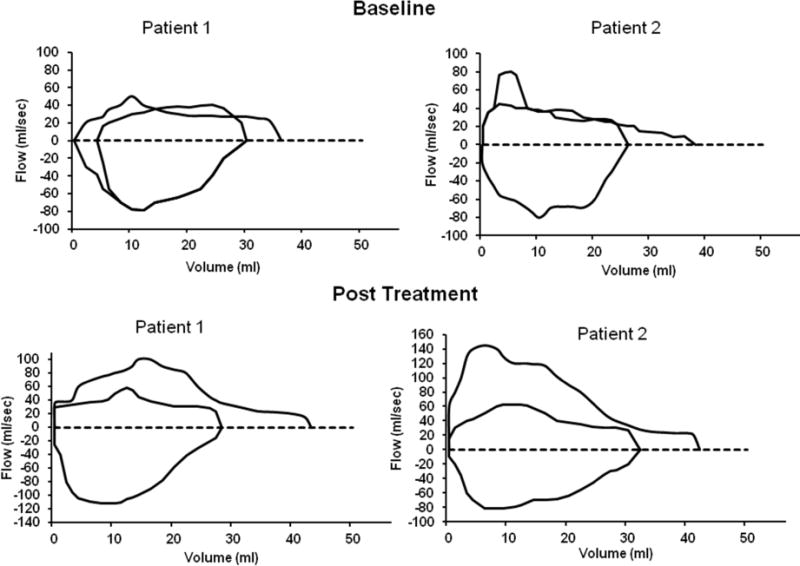
Flow volume curves for patients 1 and 2 at baseline and after 10 days of bethanechol treatment. Illustrations modified from Panitch et al. [64].
Official websites use .gov
A
.gov website belongs to an official
government organization in the United States.
Secure .gov websites use HTTPS
A lock (
) or https:// means you've safely
connected to the .gov website. Share sensitive
information only on official, secure websites.
Flow volume curves for patients 1 and 2 at baseline and after 10 days of bethanechol treatment. Illustrations modified from Panitch et al. [64].