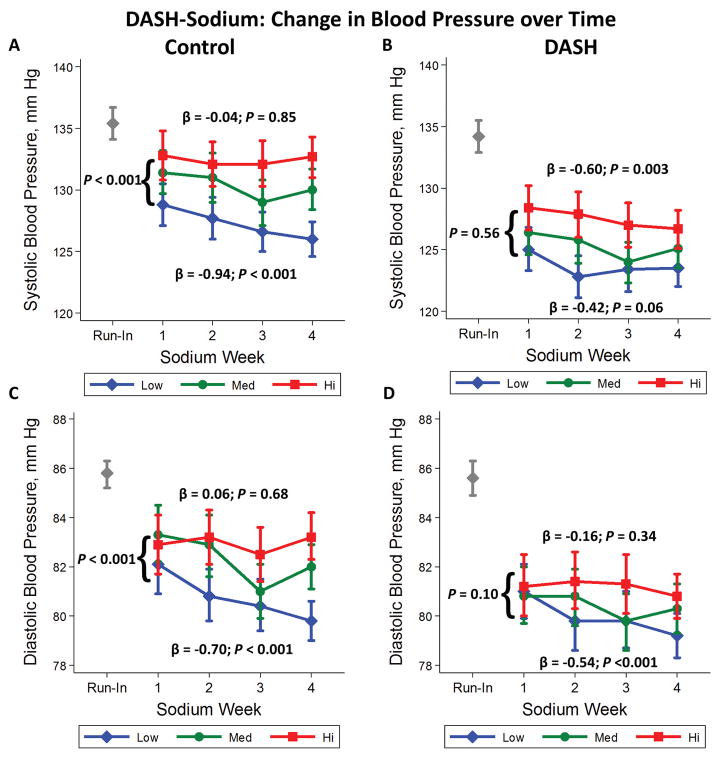
Figure 1.
Mean weekly systolic blood pressure (mm Hg) (A&B) and diastolic blood pressure (mm Hg) (C&D) while consuming high (squares), medium (circles), and low (diamonds) sodium levels. Means are presented according to assignment to the control (A&C) or DASH (B&D) diets. Beta’s represent weekly change in blood pressure. Vertical lines represent the 95% confidence intervals. The gray diamond represents the systolic or diastolic blood pressure measured after the run-in period at baseline.

