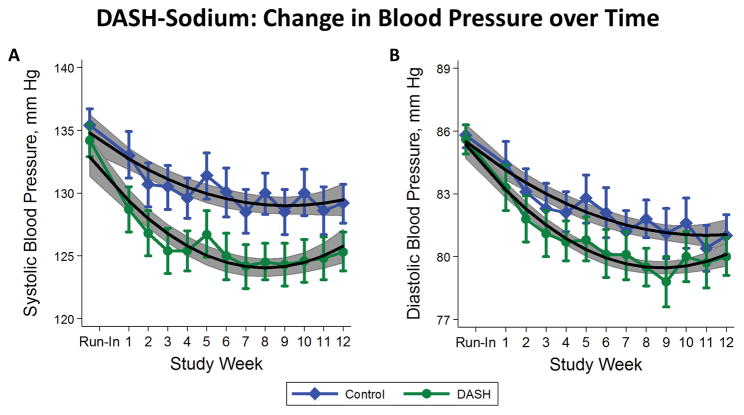
Figure 2.
Mean weekly systolic blood pressure (mm Hg) (A) and diastolic blood pressure (mm Hg) (B) while consuming the control diet (diamonds) or DASH diet (circles). Means are overlaid with quadratic linear fits to help visualize trends. Vertical lines represent the 95% confidence intervals for each mean. Gray shading represents the 95% confidence bands surrounding the quadratic models.

