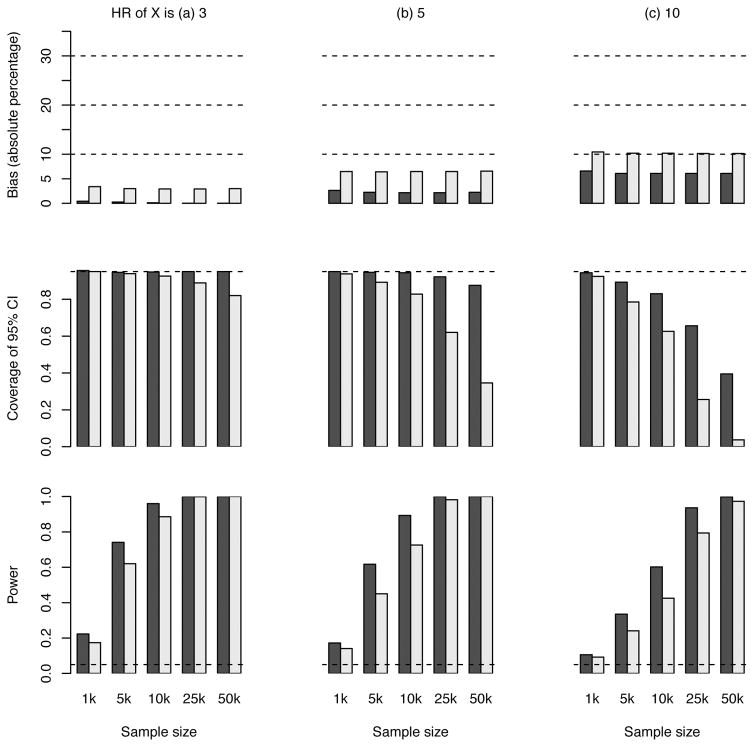
Figure 4. Results of the estimated hazard ratio (HR) for a genetic variant (scenario 1) with different sample sizes.
The HR of G is set to 1.3. The black bars pertain to population 2 (selection of subjects with fatal or non-fatal first events) and the grey bars to population 3 (selection of subjects with non-fatal first events). The dashed line in the middle panel indicates the expected coverage of 0.95. The dashed line in the lower panel indicates the nominal significance level of 0.05.

