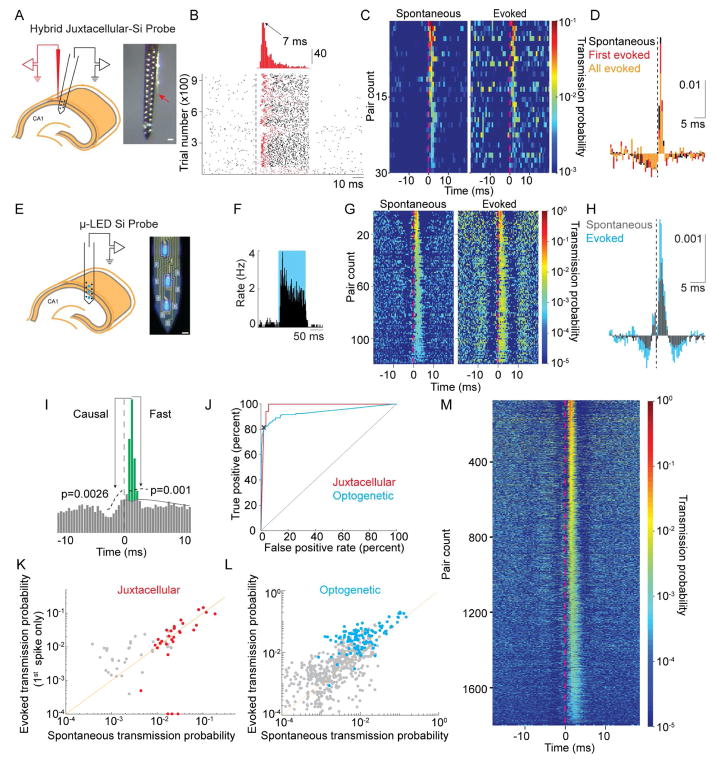
Figure 2. Single pyramidal neurons discharge postsynaptic interneurons.
A. Left: Schematic of the experiment for combined juxtacellular – extracellular recordings. Only six electrode sites are shown for clarity. Right: photomicrograph of hybrid probe. The tip of the juxtacellular electrode (red arrow) is ~50–100 μm from the closest electrode site on the silicon probe. Scale bar is 50 μm. B. Example juxtacellular stimulation of a pyramidal neuron. Top: histogram of delay times to first spike after stimulus onset. Bottom: raster of 963 trials. Dashed line is stimulus onset (50 ms duration). The first spike of each trial is colored red. C. CCGs of 30 pyramidal to interneuron pairs demonstrating similarity in spike transmission for both spontaneous and juxtacellularly evoked presynaptic spikes (all evoked spikes). D. Mean, baseline corrected CCG for spontaneous (black) or juxtacellularly evoked presynaptic spikes (first spike only in red, all evoked spikes in orange). Vertical scale bar is corrected probability. E. Left - Schematic of recording with μ-LED silicon probe. Right – photomicrograph of the silicon probe with three μLEDs illuminated. Scale bar is 15 μm. F. Example PSTH of spiking response to optogenetic stimulation of a ChR2-expressing pyramidal neuron. G. CCGs of 118 pairs demonstrating similarity in spike transmission for both spontaneous and optogenetically evoked presynaptic spikes. H. Mean, baseline corrected CCGs for spontaneous (black) or optogenetically evoked (blue) presynaptic spikes. Vertical scale bar is corrected probability. I. Illustration of parameters used to define connections from CCGs. Significant connections were those in which the peak was above the confidence bounds indicated by the dashed lines. Spike transmission probability defined by area in green (see Methods). J. Receiver–operator characteristic curve for synapse classification, with the threshold for Pcausal shown by the black X for the optogenetic classifier. This Pcausal was used to define the confidence bounds in Panel I (see Methods). K. Correlation of spike transmission probability for spontaneous spikes versus those evoked by juxtacellular current injection. Neuron pairs classified as connected are shown in red, non-significant peaks for all excitatory to inhibitory CCGs in black. L. Same as in J for optogenetic stimulation (connections in blue). For clarity, 32 non-significant points are not shown M. 1,754 monosynaptic connections identified in a dataset of 29,964 PYR/INT pairs.

