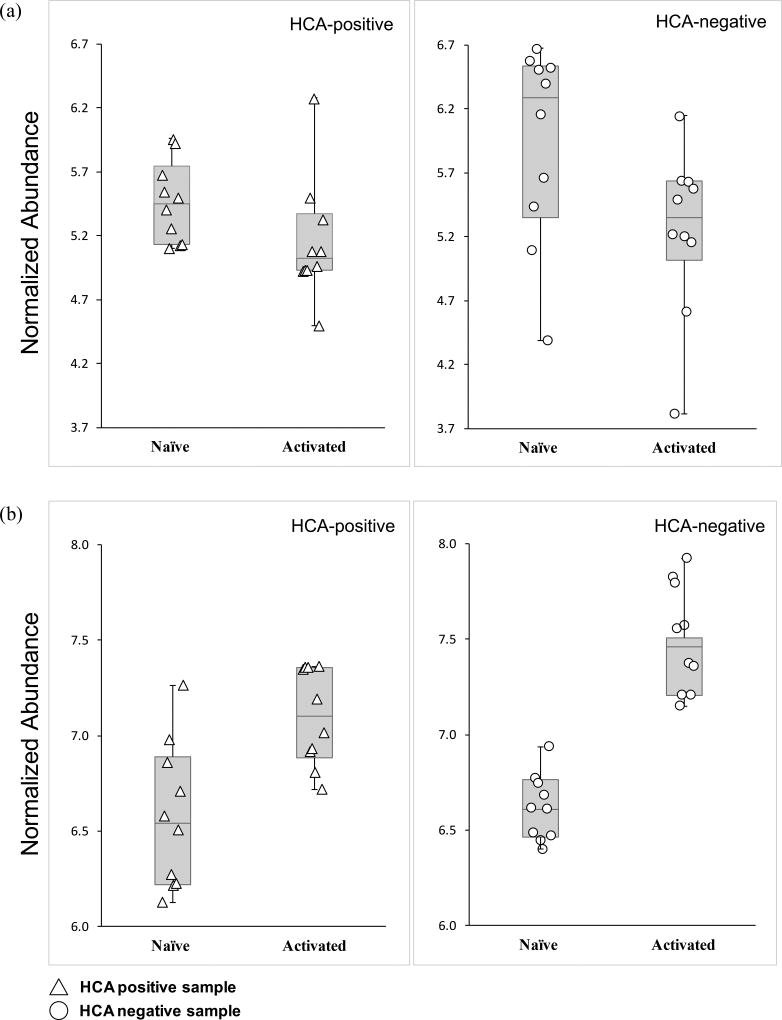
Figure 5. Exposure to HCA does not affect DA and LPC metabolism in naïve and activated CD4+ T lymphocytes.
(a) Box and whisker-plot analyses with scatter overlay depicting the normalized abundance values of the putatively identified metabolite, DA (m/z 176.07, RT 4.63 min). Error bars signify maximum and minimum detected values. HCA-positive samples are denoted by triangles and HCA-negative samples by circles. Median values are also shown.
(c) Box and whisker-plot analysis with scatter overlay depicting the normalized abundance values of the putatively identified metabolite, LPC (18:2(9Z, 12Z)) (m/z 520.35, RT 10.49 min). Error bars signify maximum and minimum detected values. HCA-positive samples are denoted by triangles and HCA-negative samples by circles. Median values are also shown.

