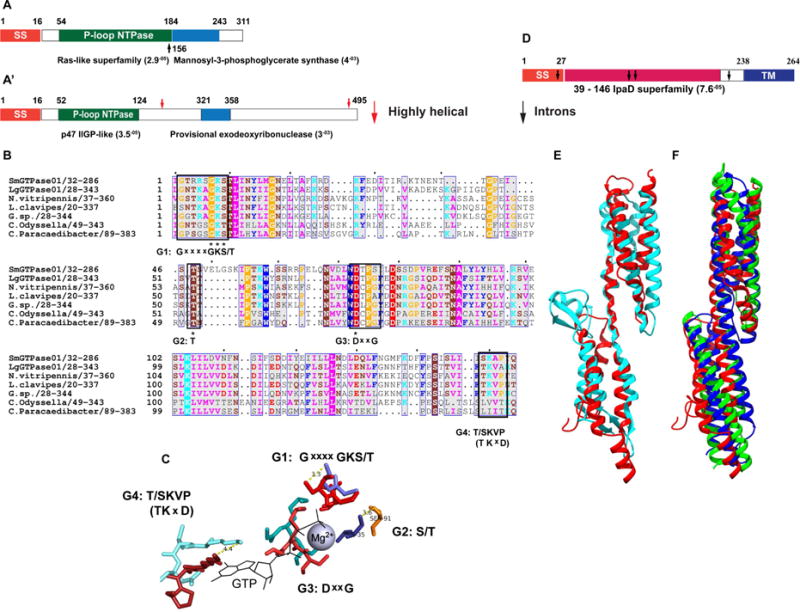
Fig 4. Structural characteristics of prokaryote-like Lh VLP GTPases and p40.

(A, A′) Domain architectures of representative SmGTPase01 (A) and LgGTPase01 (A′) based on Conserved Domains Database (CDD) and PFAM 26.0 (see Methods). (A, A′) SS = signal sequence. Starts/stops are labeled with residue number. The E-values based on CDD domain predictions are listed adjacent to domains. Black and red arrows mark overlapping domain predictions in SmGTPase01 (A) and a highly helical region in LgGTPase0 (A′), respectively. (B) A multi-sequence alignment (MSA) of Sm & LgGTPase01 (SmGTPase01 used as query) reveals that the most significantly similar sequences in the NCBI nr and TSA databases (Lh ESTs excluded) are both prokaryotic and eukaryotic (N = Nasonia; C = Candidatus). Four predicted active site G motifs are labeled below the conserved consensus residues (black boxes) in the MSA. Only the G4 consensus motif ((T/S)KVP) differs from the canonical Ras G4 motif (NKxD) [40]. Asterisks mark 100% conservation in the motifs. The coloring scheme is according to conventional physiochemical properties and sequence conservation. 100% and 99 – 50% conservation levels are indicated by white lettering and blue column boxes, respectively. (C) The predicted geometry of the G motifs in of SmGTPase01 active site (warm, orange tones) superimposed on that of HRas active site (1QRA; cool, blue tones). RMSD = 3.37 Å (calculation is based on the full-length structures and is normalized to 1QRA), TM-score = 0.74 [TM-Score > 0.5 indicates the same fold]. Distances (Å) between functionally critical residues of SmGTPase01 and HRas are indicated by dotted lines. (D) p40 domain architecture. SS = signal sequence; TM = transmembrane domain. Black arrows mark intron insertion sites. Based on CDD prediction, the central domain shares sequence and structural similarity with IpaD superfamily proteins. (E) Structural superposition of IpaD (blue, 2J0; residues 39-284) and p40 model (red, residues 28-187). The N-termini are oriented to the top right corner. The predicted signal sequence and C-terminal transmembrane helix were omitted for modeling. RMSD = 4.73 Å, TM-score = 0.56225. (F) Structural superposition of p40 model (red) to chicken spectrin (green, 1CUN; RMSD = 2.9 Å) and to human plectin (blue, 3PDY; RMSD = 3.0 Å), using the DALI server. (See also Fig S1, Data S2.)
