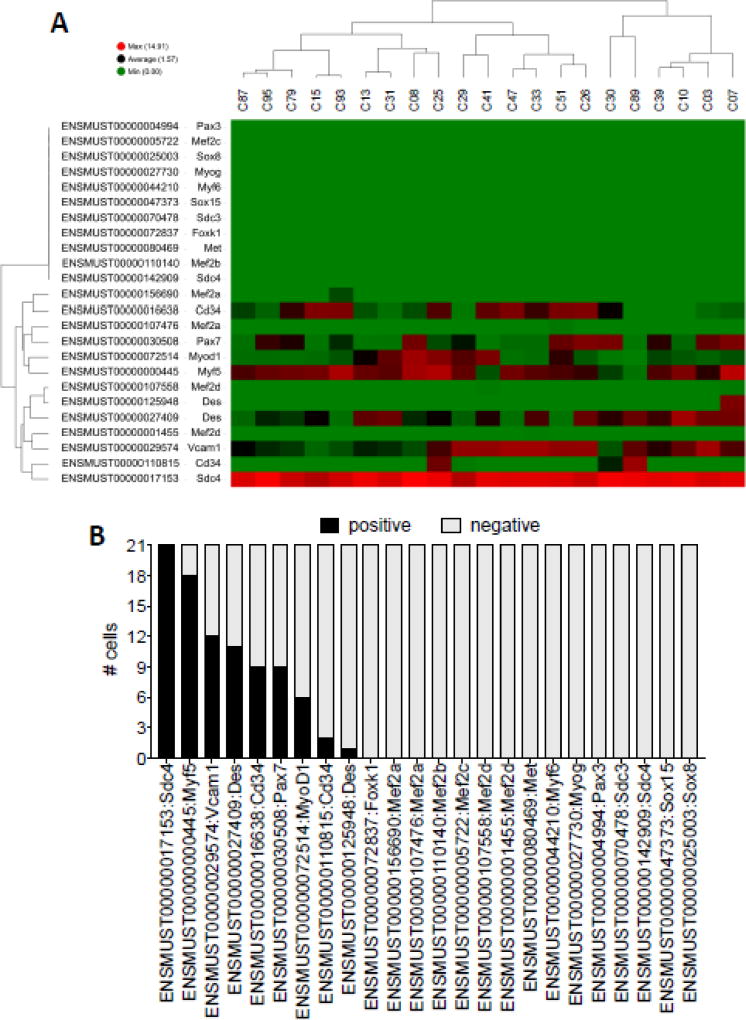
Figure 2.
Selected myogenic gene expression signature across individual SCs. (A) Heatmap of selected myogenic transcripts. Transcripts are arranged top to bottom, and individual SCs clustered left to right. Green=lower expression, red=higher expression. (B) Bar graph depicting the number of single SCs positive and negative (FPKM cutoff=5) for the indicated myogenic transcript (x-axis).

