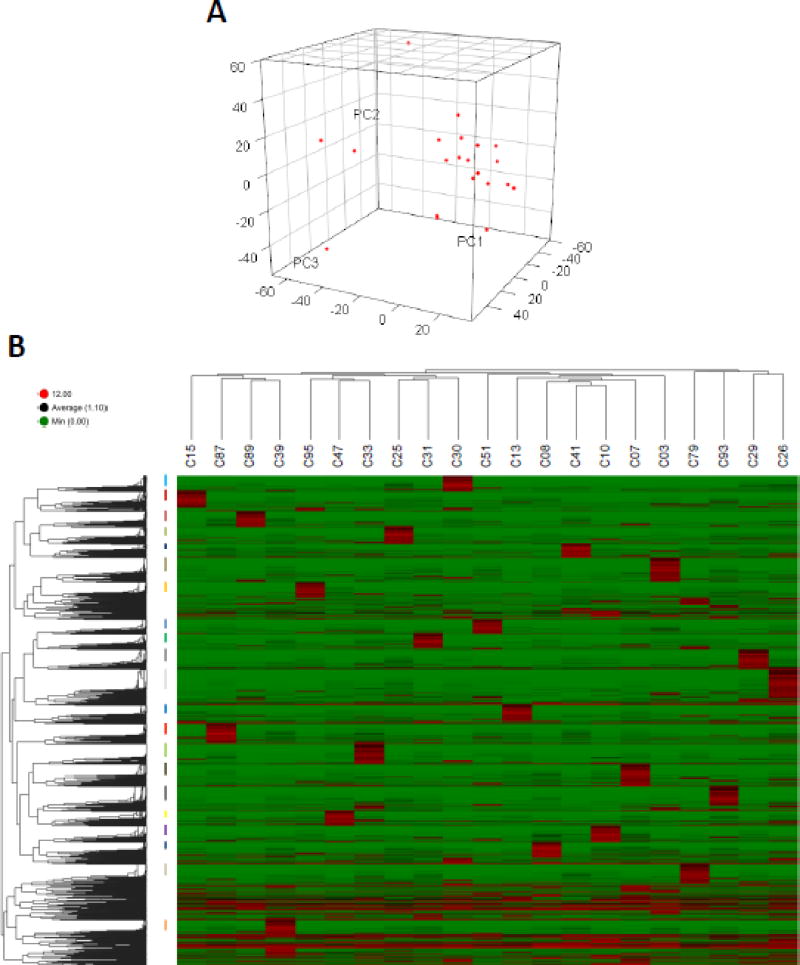
Figure 4.
Unsupervised hierarchical clustering of single-cell transcriptomes of Pax7-tdTomato+ cells. (A) Principal component analysis of single SCs. (B) Unsupervised hierarchical clustering was performed on individual SCs (top dendrogram) and on transcripts (dendrogram to the left). Log2 FPKM values are represented in a colored heatmap (green=lower expression, red=higher expression). Clusters of genes exclusively highly expressed in each sample are labeled with colored bars to the left of the heatmap.

