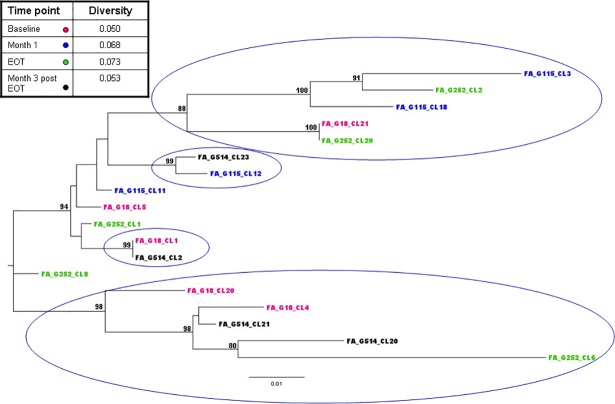
Fig 3. Phylogenetic tree of HIV-1 C2V5 nucleotide clonal sequences of subject #53 during DAA therapy.
The viral sequences at the various time points are indicated by different colours, see table insert. Bootstrap values ≥80% are indicated. Bars indicate p distance scale. In the insert mean diversity (number of nucleotide substitutions/site) of the sequences detected at different time points is reported.

