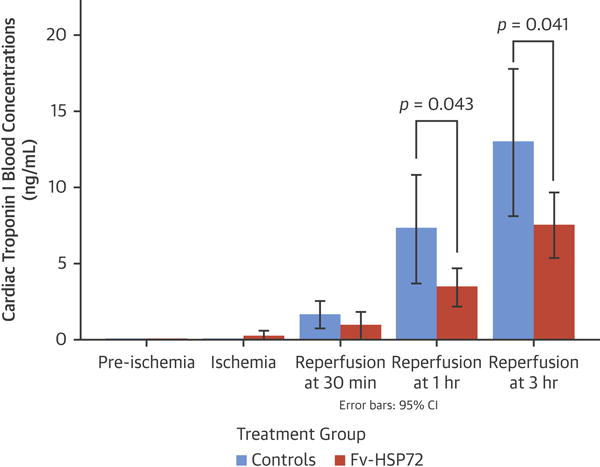
Figure 5. Troponin I Concentrations in Treated and Control Groups.

Cardiac troponin I levels were significantly lower at 1 and 3 h after reperfusion in therapy groups compared with the control groups. CI = confidence intervals; other abbreviations as in Figure 1.
