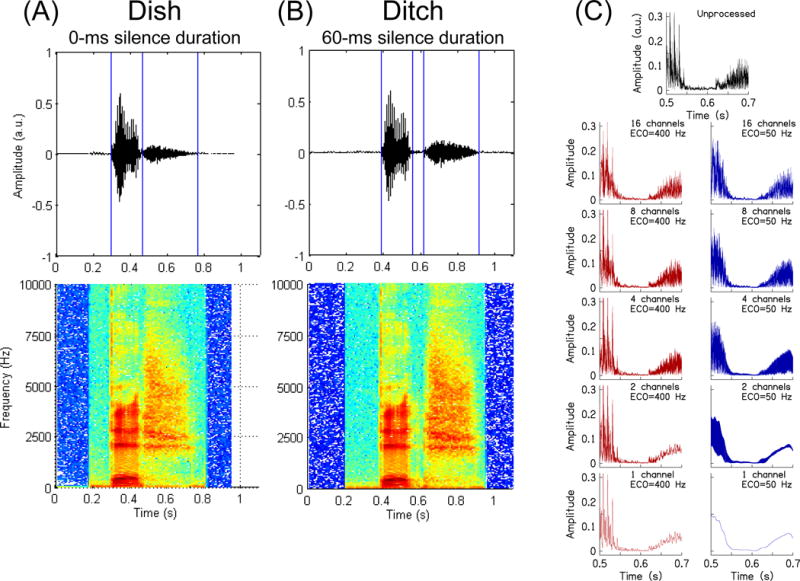
Figure 2.

Waveforms (top row) and spectrograms (bottom row) for Dish (0-ms silence duration; column A) and Ditch (60-ms silence duration; column B). Column C shows a 200-ms portion of the Ditch stimulus, centered on the silence duration. Each panel shows the temporal envelope for the unprocessed and vocoded versions of this stimulus.
