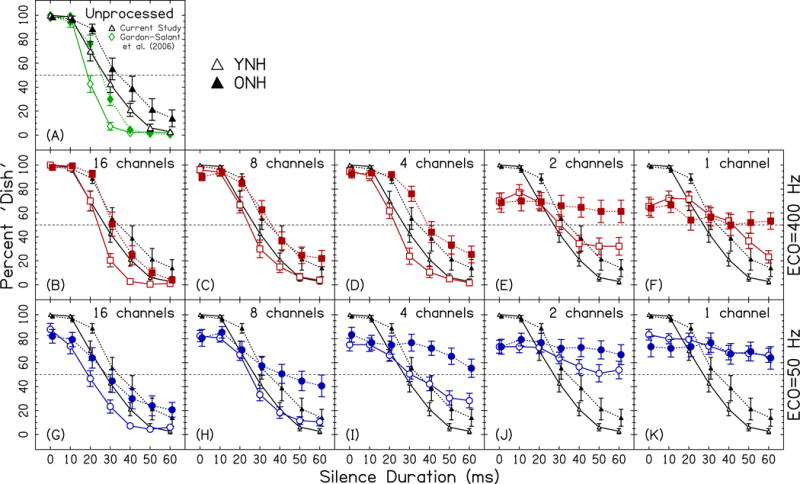
Figure 3.

Dish/Ditch response functions. Data points represent the percentage of trials identified as Dish as a function of silence duration, averaged over participants. Error bars show ±1 standard error. Open symbols show data for YNH participants; closed symbols show data for ONH participants. Panel (A) shows the data for the unprocessed conditions from the current study (black upward triangles) and Gordon-Salant et al. (2006; green diamonds). Panels (B–K) show the data for the vocoded conditions (larger symbols), and also the data for the unprocessed conditions (smaller symbols). Red squares show the data for the ECO=400-Hz conditions in panels B–F. Blue circles show the data for the ECO=50-Hz conditions in panels G–K.
