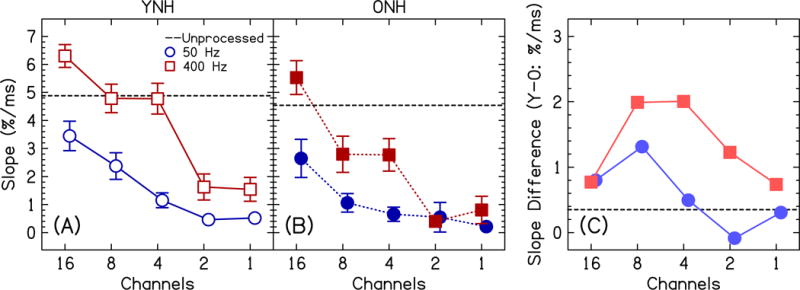
Figure 4.

Slope of Dish/Ditch response functions for the YNH group (panel A; open symbols) and the ONH group (panel B; closed symbols) as a function of the number of channels. The slopes for the unprocessed data are shown by the horizontal dashed line in each panel. The vocoded conditions are also plotted for the two ECOs (50 Hz=blue circles; 400 Hz=red squares). Error bars show ±1 standard error. Panel C shows the average difference in slope between the YNH and ONH listeners (positive numbers show larger age-related temporal processing deficits). Panel C uses light red and light blue symbols to signify that it is the difference between the YNH and ONH groups. In panel C, positive numbers show larger age-related temporal processing deficits.
