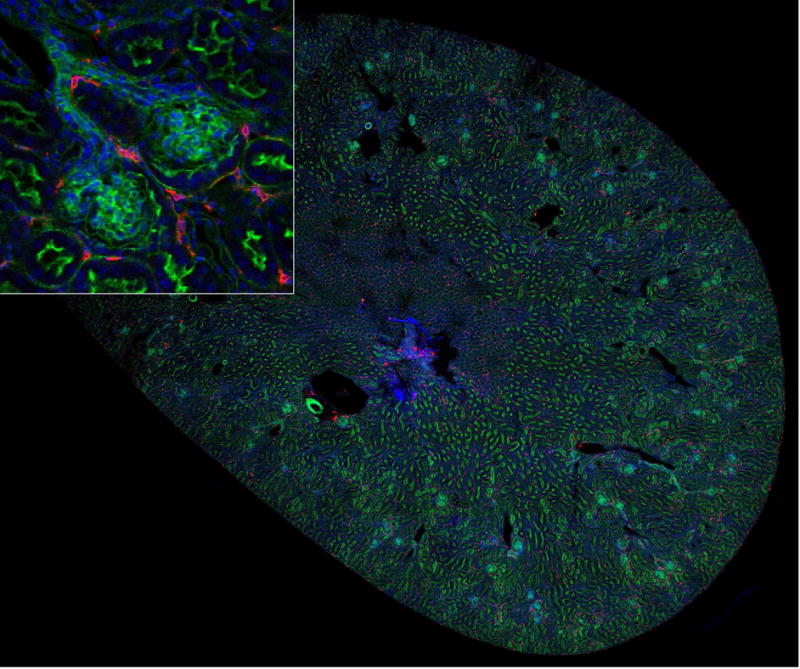
Figure 1. Mosaic of 80 image volumes collected from a mouse kidney thick section.

A 50 μm section of mouse kidney was cut with a vibratome and stained for nuclei (DAPI,blue), F-actin (green), and with an antibody against MHCII (red). Image volumes were collected using a 20X, NA 0.75 Leica objective on a Leica SP8 confocal microscope and mosaic merged in Fiji. Image field is 6 mm across. Inset – magnified region showing MHCII cells adjacent to two glomeruli.
