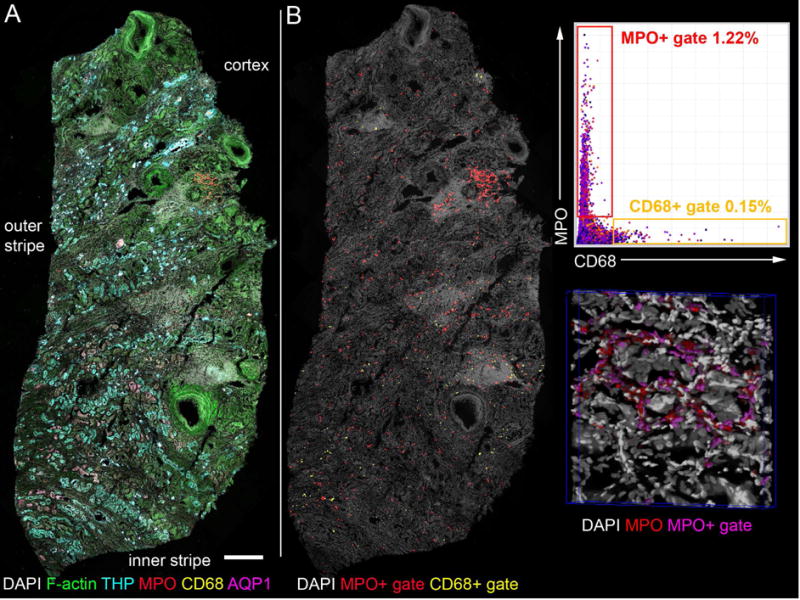
Figure 5. Six channel 3D mesoscale imaging and analysis of a human nephrectomy section by tissue cytometry.

(A) Human nephrectomy was stained for nuclei (DAPI, gray), F-actin (phalloidin-Oregon Green 488, green), myeloperoxidase (MPO, red), macrophages (CD68, yellow), Aquaporin-1(AQP1, magenta) and Tamm-Horsfall Protein (THP, cyan) and with species specific secondary antibodies labeled with Dylight594, Alexa647, Fluorescein, Alexa633 and Alexa568 respectively. Multiple overlapping volumes were imaged by confocal laser scanning microscopy, spectrally unmixed and mosaic merged. Spectral unmixing was performed with single fluorophore labeled beads as references. (B) Merged and unmixed image was analyzed by VTEA and CD68 and MPO positive cells were quantified. At right, gates were drawn on scatter plot in VTEA to identify CD68+ and MPO+ cells (yellow and red gates respectively). Left, these cells were mapped to the original volume, a maximum projection is shown (as indicated in yellow, CD68+ and red, MPO+). At lower right, a portion of the volume is rendered by Voxx in 3D with nuclei (gray), myeloperoxidase (MPO, red) and gated nuclei/cells (magenta). Scale bar = 500 μm. This image was used with permission from the Journal of the American Society of Nephrology (Cover July 2017).
