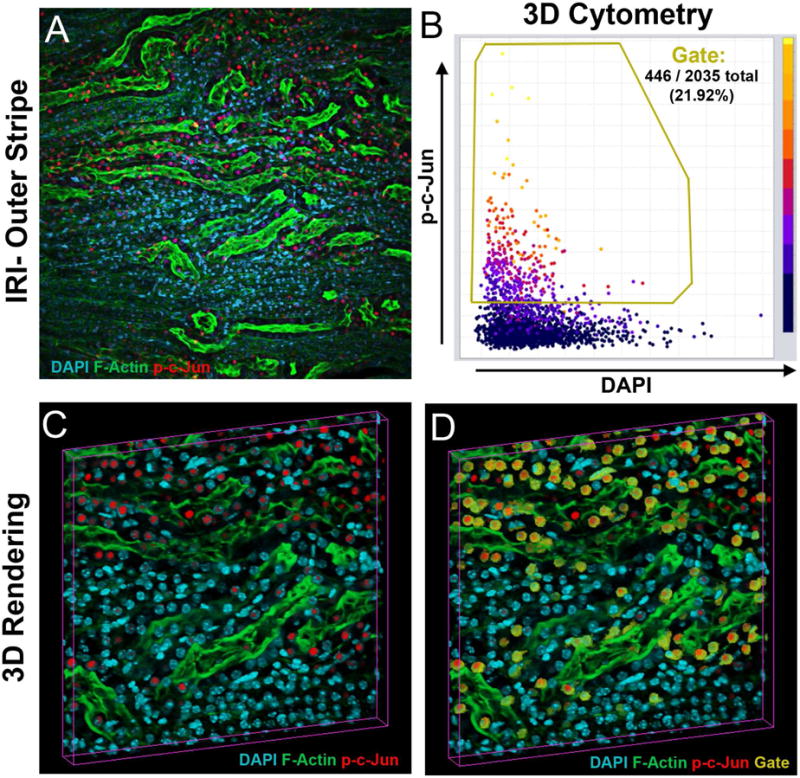
Figure 7. Kidney injury induced signaling quantified in 3D by tissue cytometry.

(A)-Z-projection of a 50μm-thick image volume from the kidney of a mouse 6 hrs after ischemia-reperfusion injury, stained for DAPI (cyan), F-Actin (green) and p-c-Jun (red). (B) VTEA scatterplot of nucleated cells, with a gate (in yellow) for cells with nuclear (activated) c-Jun. (C) Volume rendering of panel A. (D) Volume rendering with gated cells as given in B, indicated in yellow.
