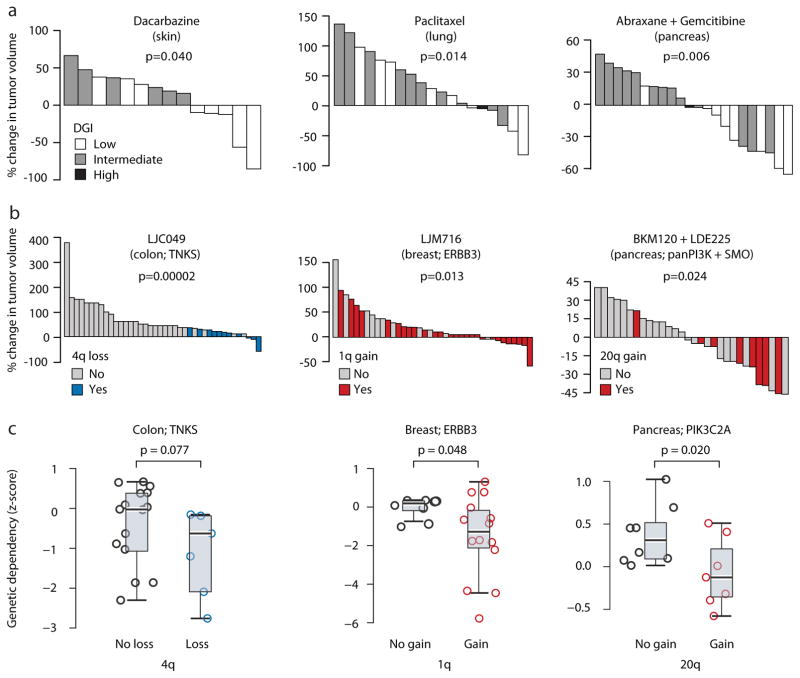
Figure 6. CNA dynamics affect PDX drug response.
(a) Extreme levels of genomic instability are associated with better therapeutic response to chemotherapies. Waterfall plots present the response to dacarbazine (n=14), paclitaxel (n=19), and the combination of abraxane and gemcitabine (n=22) in skin, lung and pancreas PDXs, respectively. DGI, degree of genomic instability. P-values indicate significance from a Wilcoxon rank-sum test. (b) The status of recurrent arm-level CNAs is associated with response to targeted therapies. Waterfall plots present the response to the TNKS inhibitor LCJ049 (n=40), the ERBB3 inhibitor LJM716 (n=38), and the combination of the PI3K inhibitor BKM120 and the SMO inhibitor LDE225 (n=31). P-values indicate significance from a Wilcoxon rank-sum test. (c). The status of recurrent arm-level CNAs is associated with the genetic depletion of the genes targeted by the identified drugs. Box plots present the dependency scores to RNAi-mediated knockdown of the indicated genes. Colon cancer cell lines with chromosome 4q loss are more sensitive to knockdown of TNKS, breast cancer cell lines with chromosome 1q gain are more sensitive to knockdown of ERBB3, and pancreatic cancer cell lines with chromosome 20q are more sensitive to knockdown of multiple PI3K genes, including PIK3C2A. P-values indicate significance from a Wilcoxon rank-sum test. -

