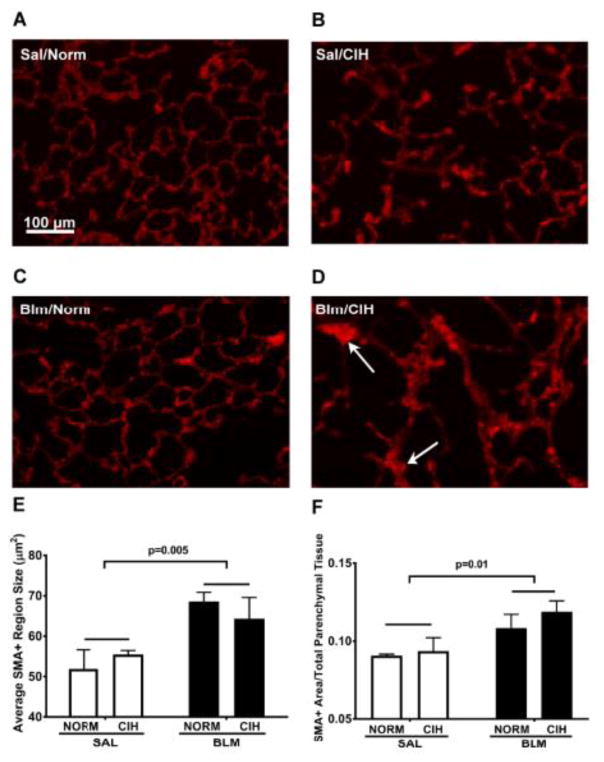
Figure 4. Thirty days of CIH following Blm injury increased average area of α-Smooth Muscle Actin positive staining relative to total lung parenchymal tissue area.
(A–D): Representative α-SMA immunostained images of Sal/Norm (A), Sal/CIH (B), Blm/Norm (C) and Blm/CIH (D) animals, 35 days after Sal or Blm treatment (20×). Emphysema-like changes are present in CIH treated animals (B, D) and increased foci of α-SMA+ staining (D; arrows) are seen in the lungs of Blm/CIH treated rats. Scale bar (shown in Panel A): 100 μm. (E): Average α-SMA+ region area (μm2). (F): Average SMA+ region area divided by total parenchymal tissue area in the microscope field, to account for presence of “emphysema-like” areas. Each symbol represents the average of all images (≥15) from one rat.

