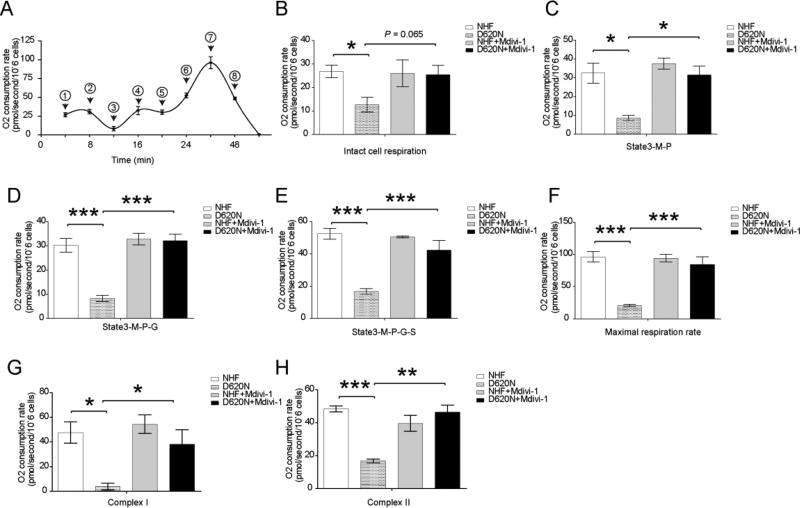
Figure.1.
Impaired complex I and II respiration in VPS35 D620N fibroblasts and the rescue by mitochondrial fission inhibitor, mdivi-1. (A) A schematic tracing of the oxygen consumption rate following protocol 1 as reported in [29] with reagents being added at sequential steps marked with a numeric symbol: 1 = 2mM malate and 2.5mM pyruvate; 2 = 2µg/ml digitonin; 3 = 2.5mM ADP; 4 = 10mM glutamate; 5 = 10mM succinate; 6 = 0.5µM increment of FCCP; 7 = 75nM rotenone; 8 = 125nM antimycin. (B–H) Quantification of OXPHOS profiles of fibroblasts. (C) State 3 rate of malate (M) + pyruvate (P). (D) State 3 rate of M + P + glutamate (G). (E) State 3 rate of succinate (S) on top of M + P + glutamate (G). (F) maximal respiration rate. (G) rotenone-sensitive complex I respiration rate. (H) Rotenone-insensitive complex II respiration rate. NHF, normal human fibroblasts. D620N, fibroblasts from the patient bearing VPS35 D620N mutant. Data are presented as mean ± SEM from 3 independent experiments. Asterisks indicate statistical significance. *p<0.05, **p<0.01, ***p<0.001.

