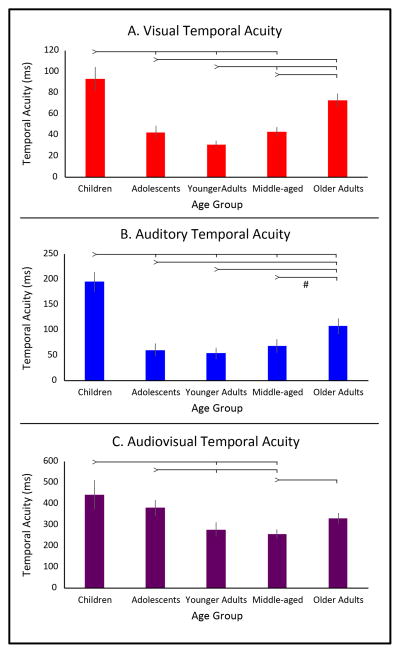
Figure 1.
Temporal acuity measured with simple flash-beep stimuli across the lifespan. Panel A depicts visual (red) temporal acuity, which increases in development into adulthood, and then declines with healthy aging. Panel B depicts auditory (blue) temporal acuity, which increases in development into adulthood, and then declines with healthy aging. Panel C depicts audiovisual (purple) temporal acuity, which increases in development into adulthood and through to middle age, and then declines with healthy aging. It should be noted that lower values on the y-axis represent more acute temporal acuity. Error bars represent standard error. Ticked lines indicate significance at the p < 0.05 level, # indicated p < 0.06.

