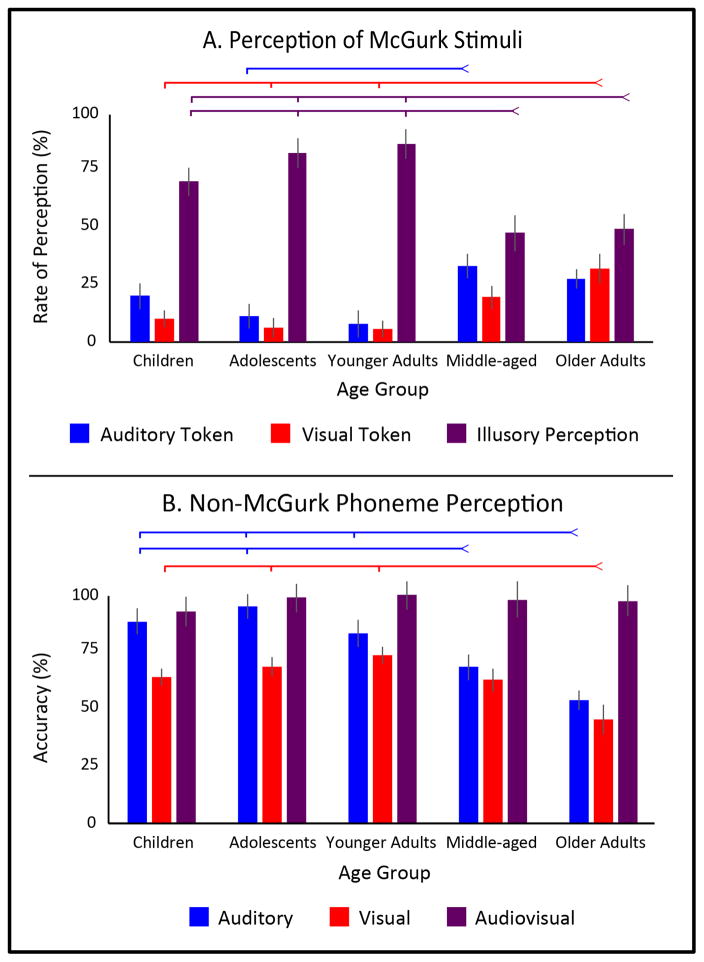
Figure 2.
The McGurk Effect and Phoneme perception throughout the lifespan. Panel A depicts responses to McGurk stimuli in which a visual “ga” was presented with an auditory “ba.” Reports of perceptions indicative of visual capture are presented in red (“ga”), auditory capture in blue (“ba”), and audiovisual integration in purple (“da”). Panel B depicts accuracy of phoneme perception with unisensory visual presentations (red), unisensory auditory presentations (blue), and congruent audiovisual presentations (purple). Ticked lines indicate significance at the p < 0.05 level, with colors matching depicted bars.

